- Access exclusive content
- Connect with peers
- Share your expertise
- Find support resources
Click Preferences to customize your cookie settings.
Unlock your full community experience!
XQL Stacked Graph
- LIVEcommunity
- Discussions
- Security Operations
- Cortex XDR Discussions
- Re: XQL Stacked Graph
- Subscribe to RSS Feed
- Mark Topic as New
- Mark Topic as Read
- Float this Topic for Current User
- Printer Friendly Page
XQL Stacked Graph
- Mark as New
- Subscribe to RSS Feed
- Permalink
09-19-2023 05:20 AM
Hello everybody,
I need to create stacked graph similar to the one on Ingestion dashboard (Daily consumption).
The graph should have DNS query name on X axis and total count on y axis. But at the same time, I need to have the column separated by DNS_query_type. I have a data in a table, but I'm not able to create a graph of this type, can you please help me?
The graph should look like the one from ELK on the following picture.
Thank you,
Jan
- Mark as New
- Subscribe to RSS Feed
- Permalink
09-21-2023 12:22 AM
That would be great, thank you.
- Mark as New
- Subscribe to RSS Feed
- Permalink
09-21-2023 11:25 AM
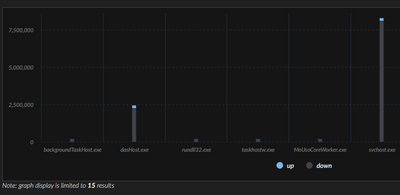
Hi @Honza_Linhart , let me share this example that I worked, is not exactly the same, but maybe it helps.
XQL Query:
dataset = xdr_data
| filter agent_hostname = "AN_ENDPOINT"
| filter event_type = NETWORK
| fields action_upload as up, action_download as down, actor_process_image_name as process
| comp sum(up) as up, sum(down) as down by process
| limit 10
| view graph type = column subtype = stacked xaxis = process yaxis = up,down
In this case, I have grouped the up/down traffic for each process in the same column.
Maybe saving the Query Types in an "alter" stage variable can work in the "yaxis" value of this stacked subtype graph type.
Let me know if this helps.
- Mark as New
- Subscribe to RSS Feed
- Permalink
09-27-2023 04:11 AM
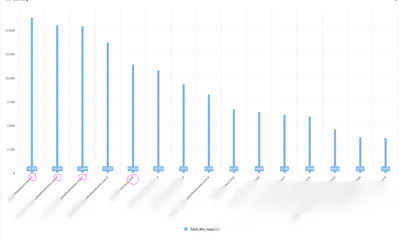
You may customize below XQL query or logic to meet your requirement. Based on below logic I have created a widget something similar/closer to the one you shared.
dataset = xdr_data
|filter event_type = ENUM.STORY and dns_query_name != NULL and dns_query_type != NULL
| fields dns_query_name , dns_query_type
| comp count(dns_query_name) as Total_dns_requests by dns_query_name , dns_query_type
| sort desc Total_dns_requests
| limit 15
|alter x_axis = concat(dns_query_name , " ", dns_query_type )
| view graph type = column subtype = stacked show_callouts = `true` xaxis = x_axis yaxis = Total_dns_requests
Hope this helps!
Please mark the response as "Accept as Solution" if it answers your query.
- Mark as New
- Subscribe to RSS Feed
- Permalink
10-01-2023 09:06 AM
Hi everybody,
I found my case a little more complicated than expected.
To be able to do a stacked graph with sum values of different DNS types for the same dns name, I need to get a table that looks like this:
DNS name | A count | NS Count | AAAA count | SRV count etc.
I tried to create fields in alter stage dynamicaly but failed, so I was able to reach my goal with following Query, that seems to be over complicated. If any of you is able to simplify it or reach the same result easier way, it would be very appreciated.
preset = network_story
| fields dns_query_name , dns_query_type
| comp count(dns_query_name) as PocetByType by dns_query_type , dns_query_name
| comp sum(PocetByType) as AbsolutSummary by dns_query_name
| join (preset = network_story
| fields dns_query_name , dns_query_type
| comp count(dns_query_name) as CountByDNSType by dns_query_type , dns_query_name)
as e e.dns_query_name = dns_query_name
| sort desc AbsolutSummary , desc CountByDNSType
| limit 100
| alter A_Type = if(dns_query_type = "A" , CountByDNSType , 0 )
| alter NS_Type = if(dns_query_type = "NS" , CountByDNSType , 0 )
| alter SOA_Type = if(dns_query_type = "SOA" , CountByDNSType , 0 )
| alter AAAA_Type = if(dns_query_type = "AAAA" , CountByDNSType , 0 )
| alter SRV_Type = if(dns_query_type = "SRV" , CountByDNSType , 0 )
| alter Unknown_Type = if(dns_query_type = "Unknown" , CountByDNSType , 0 )
| comp sum(A_Type) as A, sum(NS_Type) as NS, sum (SOA_Type) as SOA , sum (SRV_Type) as SRV , sum (Unknown_Type) as unknown by dns_query_name
| limit 15
| view graph type = column subtype = stacked show_callouts = `true` xaxis = dns_query_name yaxis = NS,SOA,SRV,unknown,A yaxminrange = 1 default_limit = `false`
- 3665 Views
- 5 replies
- 0 Likes
Show your appreciation!
Click Accept as Solution to acknowledge that the answer to your question has been provided.
The button appears next to the replies on topics you’ve started. The member who gave the solution and all future visitors to this topic will appreciate it!
These simple actions take just seconds of your time, but go a long way in showing appreciation for community members and the LIVEcommunity as a whole!
The LIVEcommunity thanks you for your participation!
- Playbook for Disabling Azure User in Cortex XSOAR Discussions
- Cortex Management Report in Cortex XDR Discussions
- CPU and Memory Usage in Cortex XSIAM Discussions
- Timeout issue - Health Issue/Alerts in XSIAM in Cortex XSIAM Discussions
- O365 Teams (Using Graph API) (Community Contribution) configuration With XSOAR in Cortex XSOAR Discussions


