- Access exclusive content
- Connect with peers
- Share your expertise
- Find support resources
Click Preferences to customize your cookie settings.
Unlock your full community experience!
Monitor incoming and outgoing network traffic
- LIVEcommunity
- Discussions
- General Topics
- Re: Monitor incoming and outgoing network traffic
- Subscribe to RSS Feed
- Mark Topic as New
- Mark Topic as Read
- Float this Topic for Current User
- Printer Friendly Page
- Mark as New
- Subscribe to RSS Feed
- Permalink
11-15-2013 02:20 PM
We are going to switch over to a new CRM system Monday that will be hosted in the cloud. I am wanting to monitor the network traffic to see what the increase is once we switch over and where there are any bottlenecks. Can someone tell me how to setup this tyupe of monitring on a Palo Alto device? I have a PA-3020
Thanks
Accepted Solutions
- Mark as New
- Subscribe to RSS Feed
- Permalink
11-18-2013 11:44 AM
Hello StGregorys,
You can run the following commands to get a general know-how about the amount of traffic flowing through the PA500
> show running resource-monitor week <1-13> // Gives you the dataplane usage in terms of last (1-13) week/s
> show session info // Gives the current snapshot of session table utilization
> show system statistics // Gives you the real time usage in terms of throughput and packet rate
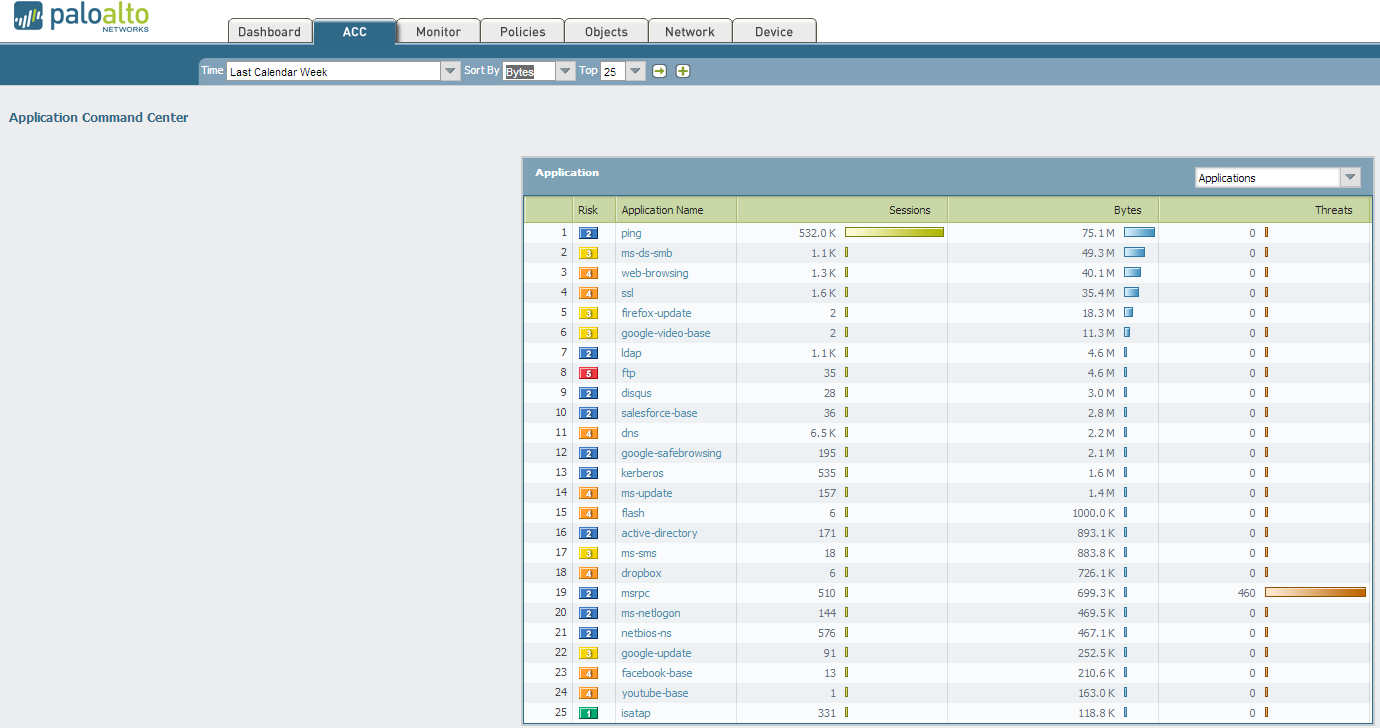
Now you can also gather some useful information through the WebUI, under ACC tab where you can sort by sessions/ bytes and also set the time.
You can also use the feature of App Scope under Monitor tab in WebUI to generate reports for bandwidth usage.
Another way to gather information from the PAN firewall would be to monitor it via SNMP and then run a report on the data using something like Splunk.
If SNMP is your preferred way, then I would recommend adopting one of the following templates to get statistics from your firewall
Zabbix - Basic PA Host Template
Not to forget session monitoring using MRTG:
Hope the above recommendation is what you are looking for.
Thanks and regards,
Kunal Adak
- 1 accepted solution
- 6034 Views
- 1 replies
- 0 Likes
Show your appreciation!
Click Accept as Solution to acknowledge that the answer to your question has been provided.
The button appears next to the replies on topics you’ve started. The member who gave the solution and all future visitors to this topic will appreciate it!
These simple actions take just seconds of your time, but go a long way in showing appreciation for community members and the LIVEcommunity as a whole!
The LIVEcommunity thanks you for your participation!
- return traffic being dropped, not being sent through the vpn tunnel in General Topics
- Conditional Advertisement / BGP Failover with Dual ISP — How to Remove ISP1 Routes on Internet Loss? in Next-Generation Firewall Discussions
- XQL question in Cortex XSIAM Discussions
- Action of allow but of Type policy deny in General Topics
- Need assistance with PA-445: general setup/VR in General Topics


