- Access exclusive content
- Connect with peers
- Share your expertise
- Find support resources
Click Preferences to customize your cookie settings.
Unlock your full community experience!
Statistics/reports on how much SSL-traffic you got?
- LIVEcommunity
- Discussions
- General Topics
- Re: Statistics/reports on how much SSL-traffic you got?
- Subscribe to RSS Feed
- Mark Topic as New
- Mark Topic as Read
- Float this Topic for Current User
- Printer Friendly Page
- Mark as New
- Subscribe to RSS Feed
- Permalink
11-11-2015 06:25 AM
Hi, any of you who knows if there is a whitepaper or such on how to generate a report or otherwise pick out the numbers/figures/graphs for how much SSL-traffic you got vs non SSL-traffic through a PA device?
That is both in bandwidth and number of concurrent sessions over time.
Accepted Solutions
- Mark as New
- Subscribe to RSS Feed
- Permalink
11-12-2015 05:08 AM
I mentioned Count metric few posts ago.
What version are you running?
I don't have "Repeat count" but just "Count" on 7.0.3
Palo Alto Networks certified from 2011
- Mark as New
- Subscribe to RSS Feed
- Permalink
11-11-2015 06:54 AM
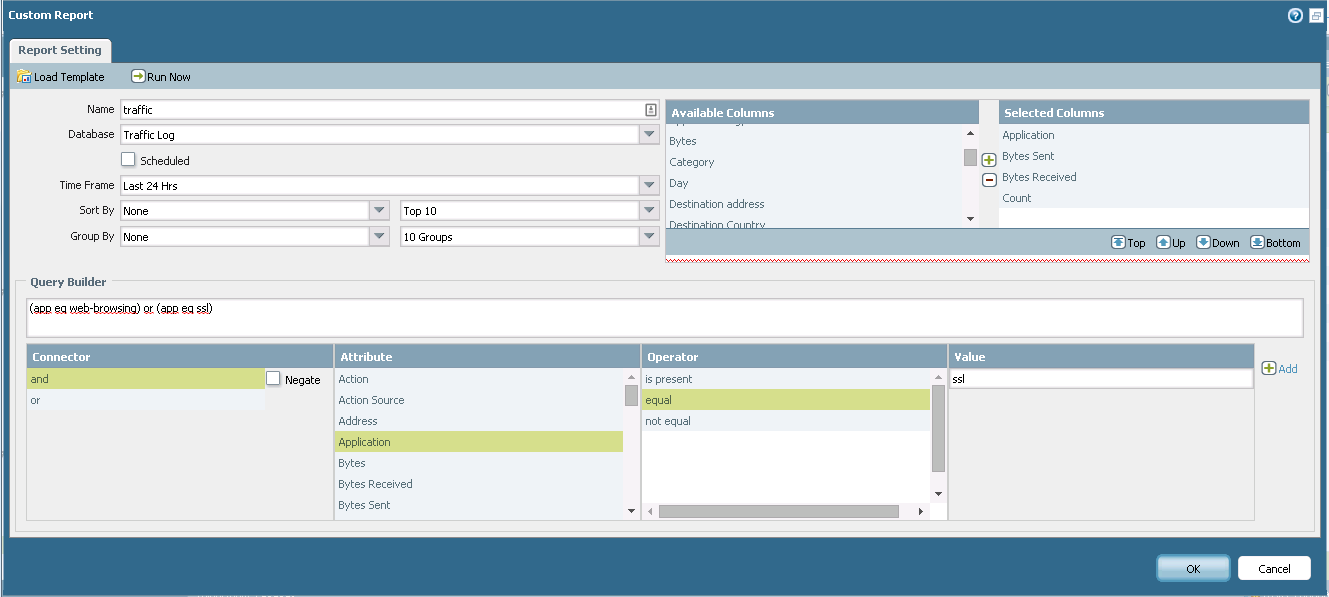
You can do this with custom report.
This will give you web-browsing vs ssl.
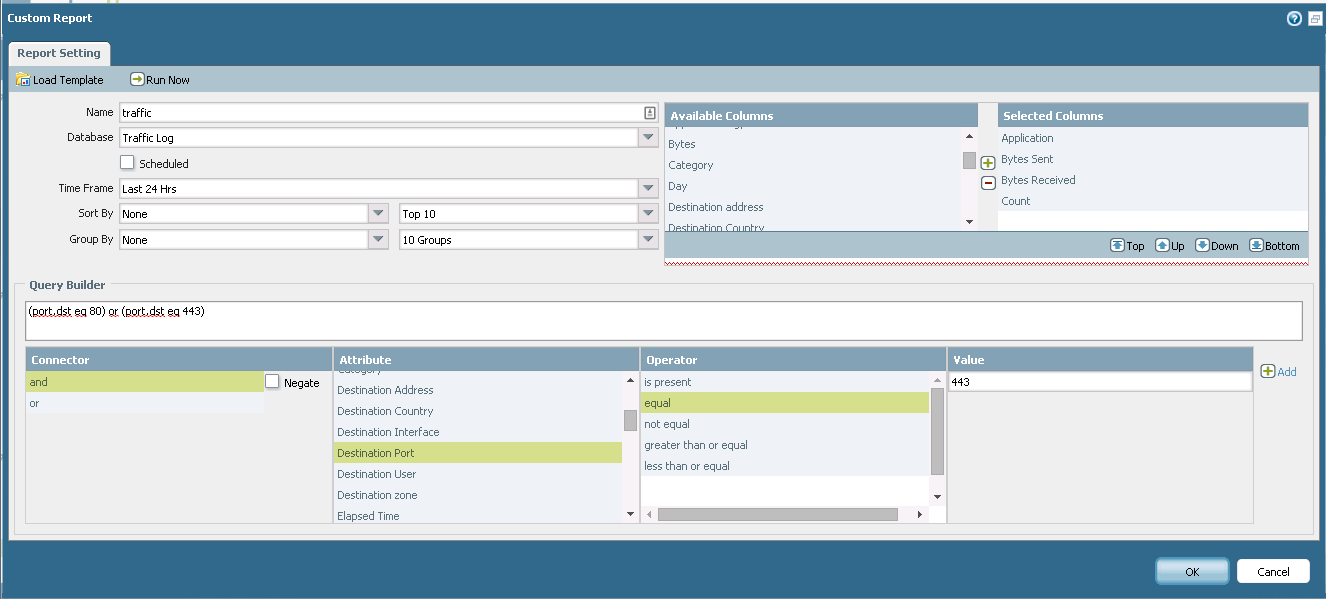
But as many many website have their own app signature and many random apps use web ports also maybe it is better to filter based on ports like on screenshot below to see all apps.
Palo Alto Networks certified from 2011
- Mark as New
- Subscribe to RSS Feed
- Permalink
11-11-2015 09:46 AM
Great thanks!
Ill try and will hopefully in the next few days return with the result.
Hopefully the TCP443 is close enough (compared to appid ssl) regarding how PA can change appid even if it doesnt SSL-terminate the session (for example if you visit youtube I would assume you will first see a ssl session but it will almost instantly change to youtube - I assume that its "youtube" who then get the bandwidth counter and not "ssl"?)
- Mark as New
- Subscribe to RSS Feed
- Permalink
11-11-2015 12:22 PM - edited 11-11-2015 12:24 PM
Basically Palo does not decide the app on you request but on server reply.
In case of ssl it is encrypted and Palo can't see inside (I suggest to decrypt ssl because all bad stuff hides in ssl these days).
When you go to https site then Palo decides the app based on name of the certificate web server sends back.
It often can identify facebook and youtube etc correctly but it can fall under ssl also sometimes so you don't get exact result.
Palo Alto Networks certified from 2011
- Mark as New
- Subscribe to RSS Feed
- Permalink
11-11-2015 12:56 PM
Yes the current case is to identify how much SSL traffic there is today and from that decide if the current PA can deal with the current load in case SSL termination would be enabled on this particular unit.
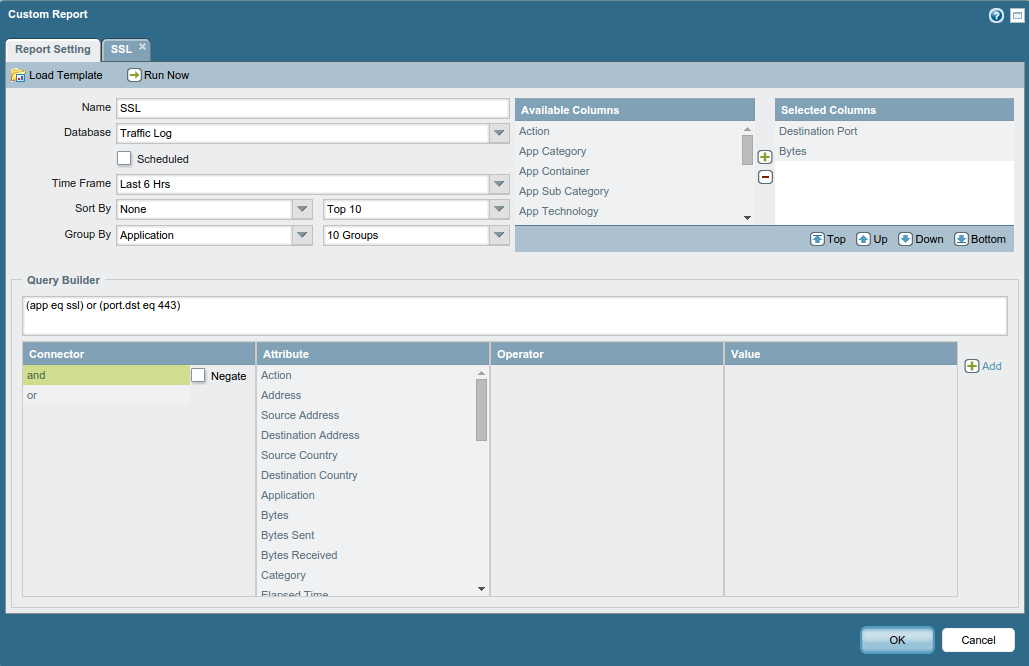
I tried your tip with the demo system running 6.0.10, it sort of gives me the data I want but Im missing number of concurrent sessions along with (if possible) how to make this into a graph over time (the graph thingy can of course be solved elsewhere like export into csv and import into excel but still).
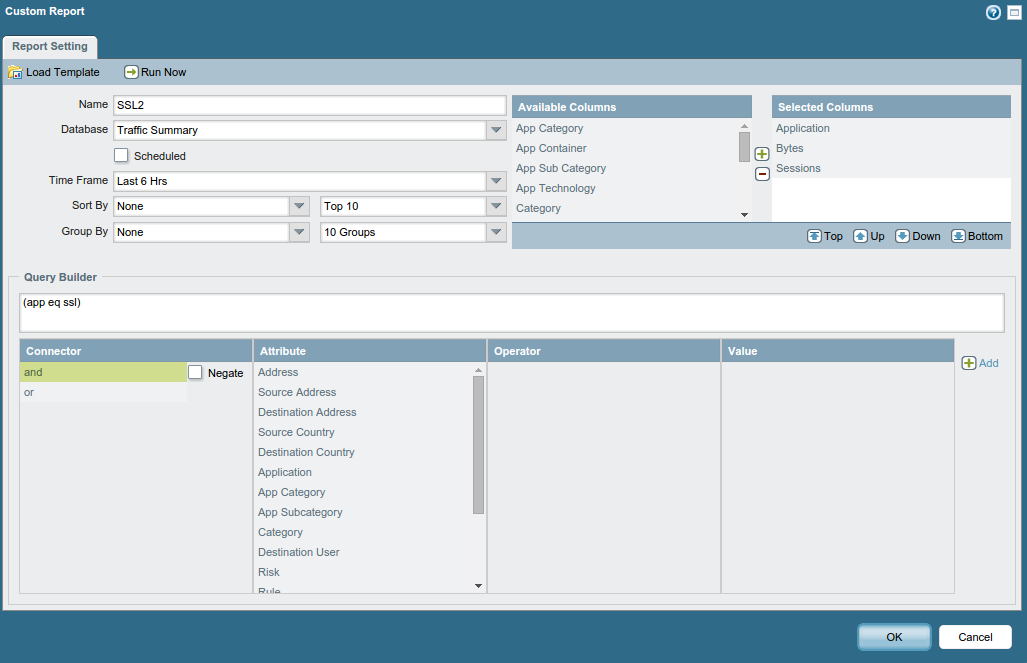
Example of the custom report in question (time frame is short in this case to make the report run faster while debugging the settings of this custom report):
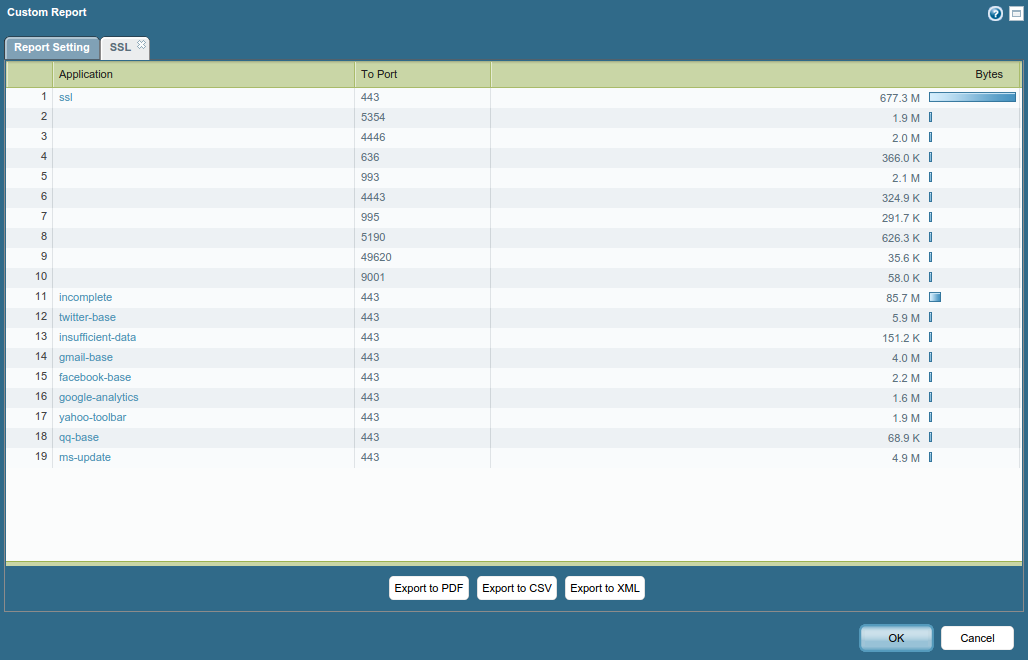
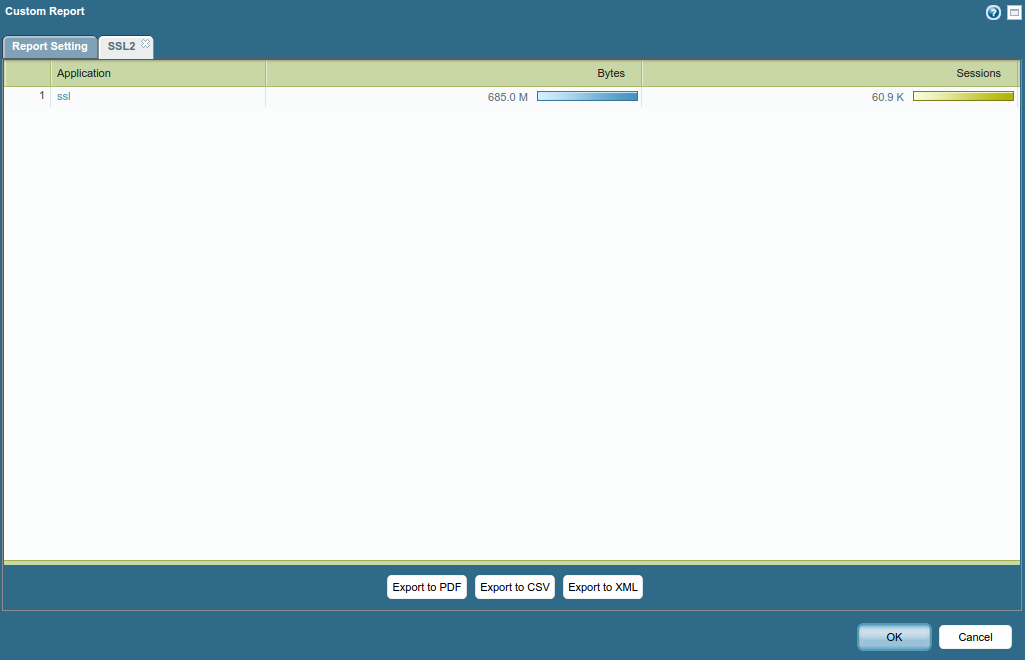
While the output is:
So the combination of appid and dst-port was great (in the above ssl + incomplete should be taken into account):
(app eq ssl) or (port.dst eq 443)
But how do I also get to see number of sessions in the same report?
- Mark as New
- Subscribe to RSS Feed
- Permalink
11-11-2015 01:32 PM
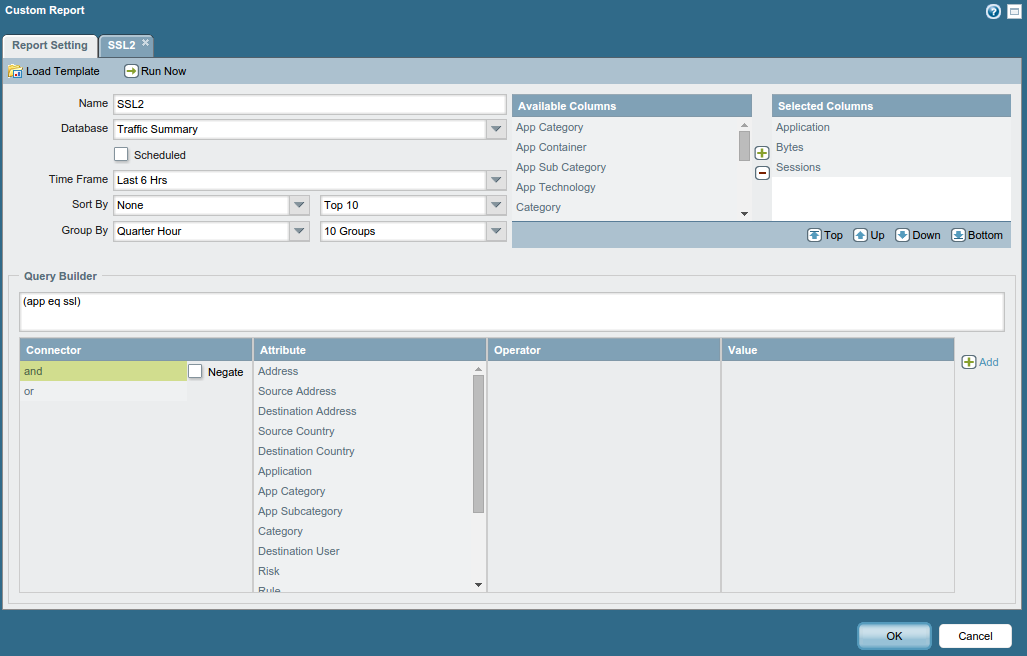
Looks like I can get sessions if I use Traffic Summary as source instead of Traffic Log:
But then I will miss being able to search for dst.port eq 443 😞
- Mark as New
- Subscribe to RSS Feed
- Permalink
11-11-2015 01:58 PM
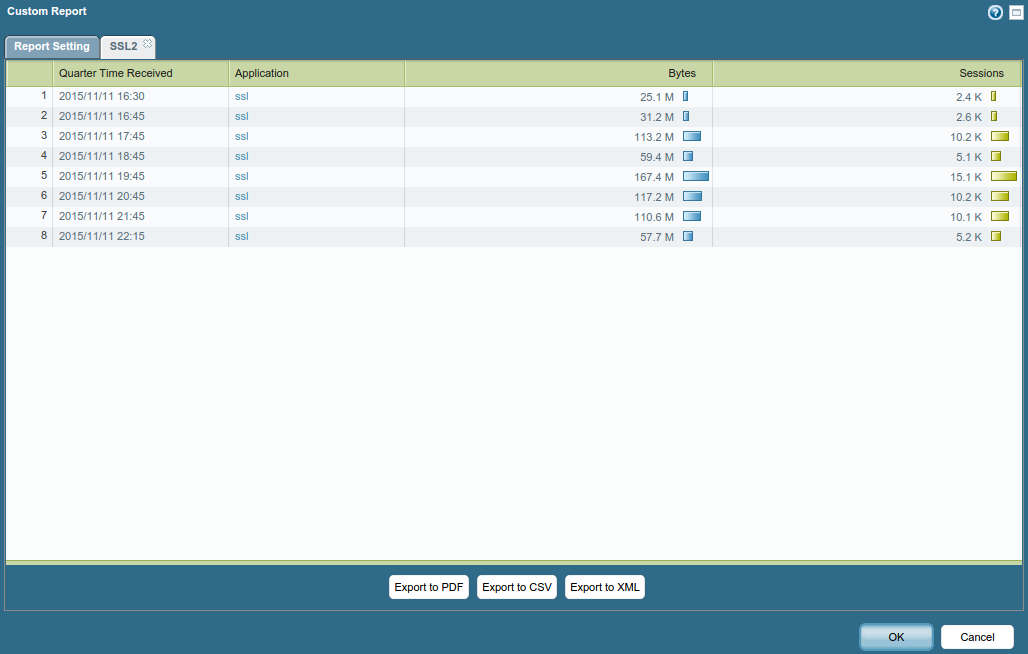
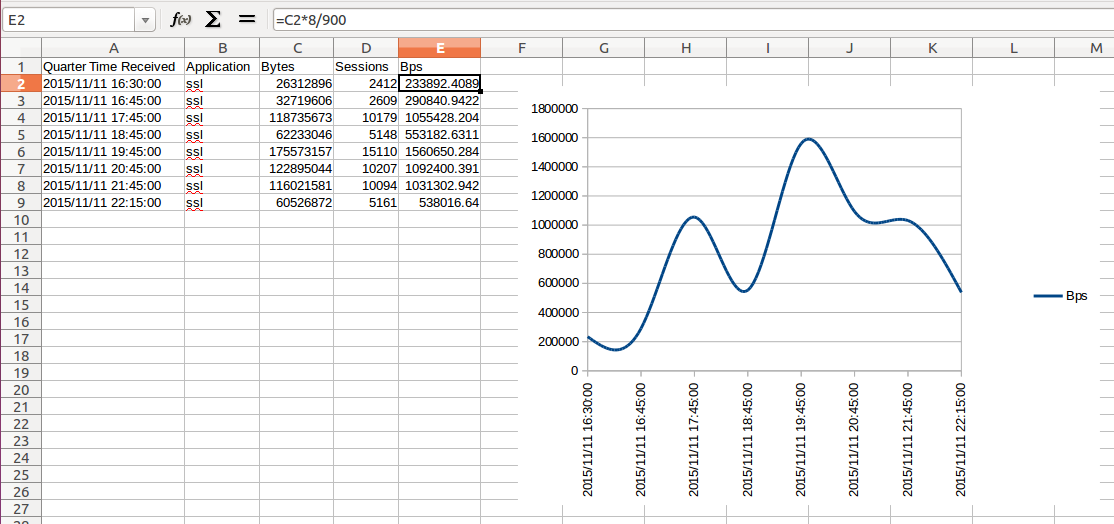
And group by quarter hour here is the result when exporting to CSV and importing into LibreOffice:
I guess this is the closest I get to find out both bandwidth and concurrent sessions over time regarding SSL traffic through a PA unit, but it would be nice if dst.port eq 443 could get involved in the above - time to file a feature request? 🙂
- Mark as New
- Subscribe to RSS Feed
- Permalink
11-11-2015 01:59 PM
Choose detailed traffic database from dropdown now summary traffic database.
It keeps more data but for less time.
Palo Alto Networks certified from 2011
- Mark as New
- Subscribe to RSS Feed
- Permalink
11-11-2015 02:02 PM
To get longer time but if you don't want to export to Excel then you can add "Day" to your output and this will give you based on day. But you don't get nice graph.
And still - try the destination port 443 option.
Then you see all apps running on port 443 (usually traffic inside ssl).
Palo Alto Networks certified from 2011
- Mark as New
- Subscribe to RSS Feed
- Permalink
11-11-2015 02:04 PM
What you mean by "but it would be nice if dst.port eq 443 could get involved in the above - time to file a feature request? :-)"?
My second screenshot shows how to filter based on port not app.
So you can do it.
Palo Alto Networks certified from 2011
- Mark as New
- Subscribe to RSS Feed
- Permalink
11-11-2015 03:37 PM
Yes but when you select Traffic Log as database as in your second screenshot you wont be able to get stats for concurrent sessions.
Sessions seems only exist in the Traffic Summary database 😞
- Mark as New
- Subscribe to RSS Feed
- Permalink
11-11-2015 03:52 PM
Not sure I follow.
Summary database contains less info than detailed database.
Can you show screenshot of your issue?
Palo Alto Networks certified from 2011
- Mark as New
- Subscribe to RSS Feed
- Permalink
11-12-2015 01:41 AM
Look at available columns to the right when you select Traffic Log vs Traffic Summary as database.
With Traffic Log "Sessions" doesnt exist, sessions only seem to exist if you select Traffic Summary.
But when you select Traffic Summary you cant search for (port.dst eq 443), that is only possible if you select Traffic Log.
The thing here, as you can see in my previous screenshots, is that when you go for Traffic Summary (in order to also get number of concurrent sessions) you will miss other appid's that used port 443 (and most likely was ssl-traffic). For example gmail-base, twitter-base, facebook-base and whatelse that there might exist.
Question here might be how complete is appid ssl when you use Traffic Summary, will that include gmail-base and other appid's who use ssl or will the counters stop count once a session switched from being identified as "ssl" into "gmail-base"?
That is if you got lets say 10GB of traffic identified as "ssl" along with 5GB identified as "gmail-base" in your report, does this mean that you in total had 10GB or 15GB traffic during this timeframe (since gmail uses ssl nowadays for all its services)?
- Mark as New
- Subscribe to RSS Feed
- Permalink
11-12-2015 02:17 AM - edited 11-12-2015 02:19 AM
Maybe you can use "count" instead of "sessions" if you choose detailed traffic log.
From cli you can use command below to get current session count for example.
show session all filter count yes application ssl
or
show session all filter count yes destination-port 443
Palo Alto Networks certified from 2011
- Mark as New
- Subscribe to RSS Feed
- Permalink
11-12-2015 02:27 AM
Yes for realtime stats I guess that would be a valid workaround but this is more about getting stats from historical data/logs 🙂
But thanks for the tip.
Regarding count ill try that and see how the output...
- 1 accepted solution
- 11601 Views
- 17 replies
- 0 Likes
Show your appreciation!
Click Accept as Solution to acknowledge that the answer to your question has been provided.
The button appears next to the replies on topics you’ve started. The member who gave the solution and all future visitors to this topic will appreciate it!
These simple actions take just seconds of your time, but go a long way in showing appreciation for community members and the LIVEcommunity as a whole!
The LIVEcommunity thanks you for your participation!


