- Access exclusive content
- Connect with peers
- Share your expertise
- Find support resources
Click Preferences to customize your cookie settings.
Unlock your full community experience!
Tracing external IPs back to internal IPs at a specific moment in time...
- LIVEcommunity
- Discussions
- General Topics
- Tracing external IPs back to internal IPs at a specific moment in time...
- Subscribe to RSS Feed
- Mark Topic as New
- Mark Topic as Read
- Float this Topic for Current User
- Printer Friendly Page
Tracing external IPs back to internal IPs at a specific moment in time...
- Mark as New
- Subscribe to RSS Feed
- Permalink
07-08-2022 10:18 AM - edited 07-08-2022 10:27 AM
In the course of tracking down security vulnerabilities, I find myself trying to trace External IPs (from external security scan reports) back to Internal IPs at a specific moment in time (the timestamp from the scan report). Most of the time, it's very simple, as many internal IPs are NAT'd 1-to-1 to external IPs. Those tend to stay static. But there are also large groups of PAT'd addresses, such as whole ranges of internal IPs (like guest WiFi network DHCP pools) that go out a single external IP.
I'm really struggling with how to track these devices down. I can rarely even find a matching internal IP for that timestamp.
Is there a specific NAT/PAT log I can reference? Or a tool for this that I'm missing? I've been trying to use the traffic logs, but that's not always fruitful and it is tedious.
Any suggestions? I'm using a Palo Alto PA-5250 running PanOS 10.2.0.
Thanks in advance,
Tom
- Mark as New
- Subscribe to RSS Feed
- Permalink
07-08-2022 10:55 AM
Hello,
First thing is to make sure you have logging at session end enabled on all of your security policies. Then you go into the Unified log and filter on source IP of the attacker. This should show all the traffic from that IP address. Then click on the paper/magnifying glass icon on the far left of the log.
This will bring up all the session details and will show you the NAT'd IP.
Hope that helps!
Regards,
- Mark as New
- Subscribe to RSS Feed
- Permalink
07-08-2022 02:24 PM - edited 07-08-2022 02:29 PM
In addition to what @OtakarKlier said above about ensuring logging at session end is enabled, the Monitor -> Logs -> Traffic viewer has many additional fields which can be selected/filtered upon by selecting the down arrow in the column name header and selecting additional fields. (Note: You can also reorder columns by dragging them to either side.)
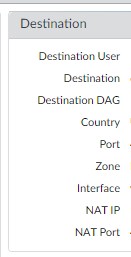
Two additional columns that are not shown by default are "NAT Source IP" and "NAT Dest IP" (as well as NAT Source/Dest Port), which show the NAT'd IP results. You can filter you traffic on these fields as well. So, for instance, if you external security report complains about an exploit attempt from your public IP to an internet IP:
2022-07-08 12:35 - 1.2.3.4:53219 -> 5.6.7.8:443
You can find all the matching outbound traffic logs with a Traffic log filter like:
( natsrc eq 1.2.3.4 ) and ( natsport eq 53219 ) and ( addr.dst in 5.6.7.8 ) and (port.dst eq 443)
You can further add time filters to narrow down a window, though be aware that while log receive time appears to be a log database index, session start time is not. So queries using start time may take much longer/time out when searching (you can work around this by also using a wide receive time filter to pre-narrow the results subsequently filtered by the start time filter).
... and (receive_time geq '2022/07/08 12:30) and (receive_time leq '2022/07/08 12:50) and (start_time geq '2022/07/08 12:30)
- 3423 Views
- 2 replies
- 0 Likes
Show your appreciation!
Click Accept as Solution to acknowledge that the answer to your question has been provided.
The button appears next to the replies on topics you’ve started. The member who gave the solution and all future visitors to this topic will appreciate it!
These simple actions take just seconds of your time, but go a long way in showing appreciation for community members and the LIVEcommunity as a whole!
The LIVEcommunity thanks you for your participation!
- Es posible bloquear una IP en cortex xdr pro in Cortex XDR Discussions
- Is the unified RPC interface (MonitorDirect.enqueueLogRequest) supported for external use? in Next-Generation Firewall Discussions
- Prisma Access (SWG):- Need to give access of Github's specific repositories to specific prisma access users in Prisma Access Discussions
- Question about ECH and its effect on URL filtering (without decryption) + how to block it in General Topics
- User ID mapping works on DC but not/intermittent on branches for Intune internal users. in GlobalProtect Discussions


