TS Agent 6.0.3 on Windows Server 2012

cancel
Showing results for 
Show  only  | Search instead for 
Did you mean: 
Announcements
Please sign in to see details of an important advisory in our Customer Advisories area.

TS Agent 6.0.3 on Windows Server 2012

L2 Linker

Hi all,

this is my environment:

PA3020 PANOS 6.0.2

3 Terminal Servers running on Windows Server 2012 R2 Datacencer, each one having PA TS Agent 6.0.3-8 onboard.

Documentation states that Windows Server 2012 is supported by TS Agent starting from 6.0.2, it's been a very long time I was waiting for this, till now I've tried previous versions of TS Agent in compatibility mode but the issue was that logged-in user traffic was generated from System Source Port Allocation Range instead Source Port Allocation Range althoug logged-in users were apparently assigned with correct source port ranges.

Now that I moved to TS agent 6.0.3 I was hoping to solve but I'm in the very same situation: logged-in user traffic is being generated from System Source Port Allocation Range instead User Source Port Allocation Range

Let's have a look to my TS agent configuration

It should be as best practice is suggesting.

And here you can see the correct user-portrange mappings

Unfortunately only a little bit of logged-in user traffic comes out from assigned port ranges, but most of all it comes from system allocated ports

I've successfully shrinked the System Port Allocation Range with commands netsh int <ipv4|ipv6> set dynamic <tcp|udp> start=number num=range hoping it'll have reduced the chance the traffic would be sourced from those ports but still no way to obtain the purpose and most of sessions originate from system range...
Please note that none of the users are logged in with /admin option.

Is there anything missing/wrong?

Thank You

13 REPLIES 13

L4 Transporter

Hello

While we investigate why the ports are showing up as the system source ports rather than the user source ports, could you please confirm one thing: do you have User Identification enabled on the zone this traffic comes in on? This might explain the "empty" field you see for source user.

Also, what is the version of the PAN OS on the firewall? Also, is this happening on the GUI only, or do you find that the CLI also reports the same incorrect info for the ports and shows no users for the source user?

Hi, yes sorry not to have specified, "lan" zone you can see in the traffic log has already user-identification enabled, all UID Agent mappings are working and all traffic is seen as "user traffic" and not simple ip traffic.

The reason why a say "most of traffic coming from terminal servers" is that a tiny little bit of it is seen with user information, but all the rest is with empty user, let's say 99%...

Hope it helps

What is the version of the PAN OS on the firewall? Also, is this happening on the GUI only, or do you find that the CLI also reports the same incorrect info for the ports and shows no users for the source user?

PANOS is 6.0.2

As for the cli, if mean the show user ip-port-user-mapping all command, yes it shows the same mappings.

TS-Agent 172.30.2.121

Vsys 1, Flag 3

Port range: 20000 - 57499

Port size: start 400; max 4000

Block count 94, port count 37500

20000-20399: ********\******

22800-23199: ********\******

23600-23999: ********\******
....

Besides I have no match on the correct sec rules where users are indicated

If you need some other output let me know.


To view user ip port mappings you should use
show user ip-port-user-mapping

When looking at the URL Filtering Logs the information for TS Agent user ip mappings is not available in there.

The debug logs of user id daemon would also show the correct mappings.

However, if you are not hitting the correct security rules, then there appears to be another issue. What do you see in the traffic logs? Can you share the output of a "show session info filter source <source user>"?

I believe I've not explained, if one of my terminal servers is, i.e., 172.30.2.121 and in the Traffic Log I use the filter " ( addr.src in 172.30.2.121 ) " I can see a lot of traffic sourced from the server, almost all of it is with EMPTY user and source port=System Port Allocation Range, a little bit is with user and source port=User Port Allocation Range
Isn't this enough to say that I don't have user information for the server?

I've made test rules with source ip only=terminal servers and user=any, and of course they're hit. I can't explain how many rules are in production, some servers are to be filtered accounting for logged in users, some servers not, now it's not of interest, the matter is that I don't have user information on TS servers.

After show session info there is no other option

admin@itsg-fw2(active)> show session info

  |        Pipe through a command

  <Enter>  Finish input

Sorry, typo:

The command is

show session all filter source <source user>


Am trying to determine if you are missing info in only the GUI logs or does the device genuinely not see the users mapped correctly.


The URL filtering logs will not show the user when users are mapped from the TS agent

The traffic logs should and the session info should


Ok, now I'm logged in on 172.30.2.121

If filtering by ip-only I see traffic

show session all filter source 172.30.2.121

--------------------------------------------------------------------------------

ID          Application    State   Type Flag  Src[Sport]/Zone/Proto (translated IP[Port])

Vsys                                          Dst[Dport]/Zone (translated IP[Port])

--------------------------------------------------------------------------------

73733        undecided      ACTIVE  FLOW  NS   172.30.2.121[60449]/lan/6  (193.110.151.6[29772])

vsys1                                          68.67.179.159[80]/wan1  (68.67.179.159[80])

222914       web-browsing   ACTIVE  FLOW  NS   172.30.2.121[60464]/lan/6  (193.110.151.6[58695])

vsys1                                          79.140.82.50[80]/wan1  (79.140.82.50[80])

89324        twitter-base   ACTIVE  FLOW  NS   172.30.2.121[60462]/lan/6  (193.110.151.6[28556])

vsys1                                          68.232.35.139[80]/wan1  (68.232.35.139[80])

218569       undecided      ACTIVE  FLOW  NS   172.30.2.121[60452]/lan/6  (193.110.151.6[8920])

vsys1                                          69.89.76.20[80]/wan1  (69.89.76.20[80])

167940       undecided      ACTIVE  FLOW  NS   172.30.2.121[60450]/lan/6  (193.110.151.6[10337])

vsys1                                          208.71.122.1[80]/wan1  (208.71.122.1[80])

When filtering for user also I have no traffic from the same source IP, even though it's me that generates the requests you can ses above

show session all filter source-user *****\**** source 172.30.2.121

Also how can the device see the users mapped correctly if traffic has high source ports not mapped to any users..?

Could you share the netstat from the server running the TS Agent?

Sure, here's the output netstat -na

Active Connections

  Proto  Local Address          Foreign Address        State

  TCP    0.0.0.0:135            0.0.0.0:0              LISTENING

  TCP    0.0.0.0:445            0.0.0.0:0              LISTENING

  TCP    0.0.0.0:3389           0.0.0.0:0              LISTENING

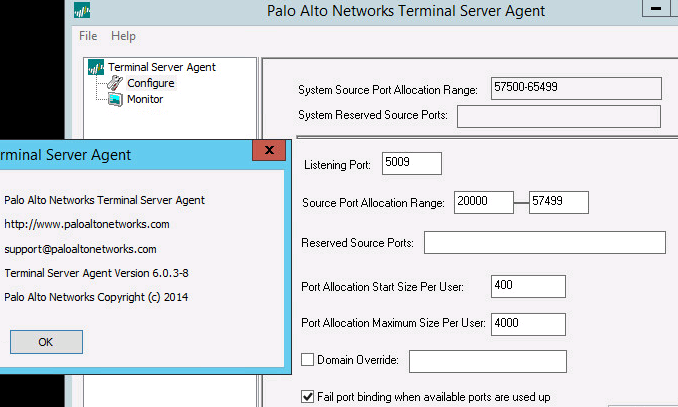
  TCP    0.0.0.0:5009           0.0.0.0:0              LISTENING

  TCP    0.0.0.0:5985           0.0.0.0:0              LISTENING

  TCP    0.0.0.0:8192           0.0.0.0:0              LISTENING

  TCP    0.0.0.0:8193           0.0.0.0:0              LISTENING

  TCP    0.0.0.0:8194           0.0.0.0:0              LISTENING

  TCP    0.0.0.0:47001          0.0.0.0:0              LISTENING

  TCP    0.0.0.0:57500          0.0.0.0:0              LISTENING

  TCP    0.0.0.0:57501          0.0.0.0:0              LISTENING

  TCP    0.0.0.0:57502          0.0.0.0:0              LISTENING

  TCP    0.0.0.0:57503          0.0.0.0:0              LISTENING

  TCP    0.0.0.0:57504          0.0.0.0:0              LISTENING

  TCP    0.0.0.0:57505          0.0.0.0:0              LISTENING

  TCP    0.0.0.0:57506          0.0.0.0:0              LISTENING

  TCP    0.0.0.0:57539          0.0.0.0:0              LISTENING

  TCP    0.0.0.0:57540          0.0.0.0:0              LISTENING

  TCP    0.0.0.0:57543          0.0.0.0:0              LISTENING

  TCP    0.0.0.0:57550          0.0.0.0:0              LISTENING

  TCP    127.0.0.1:5009         127.0.0.1:23602        ESTABLISHED

  TCP    127.0.0.1:23602        127.0.0.1:5009         ESTABLISHED

  TCP    127.0.0.1:57530        127.0.0.1:57532        ESTABLISHED

  TCP    127.0.0.1:57531        127.0.0.1:57533        ESTABLISHED

  TCP    127.0.0.1:57532        127.0.0.1:57530        ESTABLISHED

  TCP    127.0.0.1:57533        127.0.0.1:57531        ESTABLISHED

  TCP    127.0.0.1:57537        0.0.0.0:0              LISTENING

  TCP    172.30.2.121:139       0.0.0.0:0              LISTENING

  TCP    172.30.2.121:3389      192.168.254.142:51599  ESTABLISHED

  TCP    172.30.2.121:5009      172.30.4.202:41050     ESTABLISHED

  TCP    172.30.2.121:8194      172.30.2.99:3469       ESTABLISHED

  TCP    172.30.2.121:8194      172.30.2.121:57538     ESTABLISHED

  TCP    172.30.2.121:23939     204.79.197.200:443     ESTABLISHED

  TCP    172.30.2.121:57536     172.30.2.99:8194       ESTABLISHED

  TCP    172.30.2.121:57538     172.30.2.121:8194      ESTABLISHED

  TCP    172.30.2.121:57540     172.30.2.121:57541     ESTABLISHED

  TCP    172.30.2.121:57541     172.30.2.121:57540     ESTABLISHED

  TCP    172.30.2.121:57558     172.30.2.120:49197     ESTABLISHED

  TCP    172.30.2.121:57582     172.30.2.8:445         ESTABLISHED

  TCP    172.30.2.121:59974     172.30.4.134:49231     ESTABLISHED

  TCP    172.30.2.121:60629     172.30.4.86:135        TIME_WAIT

  TCP    172.30.2.121:60630     172.30.4.86:49158      TIME_WAIT

  TCP    172.30.2.121:60634     172.30.4.86:49158      TIME_WAIT

  TCP    172.30.2.121:60635     172.30.2.120:49197     TIME_WAIT

  TCP    [::]:135               [::]:0                 LISTENING

  TCP    [::]:445               [::]:0                 LISTENING

  TCP    [::]:3389              [::]:0                 LISTENING

  TCP    [::]:5009              [::]:0                 LISTENING

  TCP    [::]:5985              [::]:0                 LISTENING

  TCP    [::]:47001             [::]:0                 LISTENING

  TCP    [::]:57500             [::]:0                 LISTENING

  TCP    [::]:57501             [::]:0                 LISTENING

  TCP    [::]:57502             [::]:0                 LISTENING

  TCP    [::]:57503             [::]:0                 LISTENING

  TCP    [::]:57504             [::]:0                 LISTENING

  TCP    [::]:57505             [::]:0                 LISTENING

  TCP    [::]:57506             [::]:0                 LISTENING

  TCP    [::]:57543             [::]:0                 LISTENING

  TCP    [::]:57550             [::]:0                 LISTENING

  UDP    0.0.0.0:123            *:*                   

  UDP    0.0.0.0:500            *:*                   

  UDP    0.0.0.0:3389           *:*                   

  UDP    0.0.0.0:4500           *:*                   

  UDP    0.0.0.0:5355           *:*                   

  UDP    0.0.0.0:51235          *:*                   

  UDP    0.0.0.0:57543          *:*                   

  UDP    0.0.0.0:57544          *:*                   

  UDP    0.0.0.0:58214          *:*                   

  UDP    0.0.0.0:60646          *:*                   

  UDP    127.0.0.1:20000        *:*                   

  UDP    127.0.0.1:23600        *:*                   

  UDP    127.0.0.1:57542        *:*                   

  UDP    127.0.0.1:59879        *:*                   

  UDP    127.0.0.1:59880        *:*                   

  UDP    127.0.0.1:61017        *:*                   

  UDP    172.30.2.121:137       *:*                   

  UDP    172.30.2.121:138       *:*                   

  UDP    [::]:123               *:*                   

  UDP    [::]:500               *:*                   

  UDP    [::]:3389              *:*                   

  UDP    [::]:4500              *:*                   

  UDP    [::]:5355              *:*                   

In bold the connection from firewall to agent.

Thanks for sharing

I seems that we will have to look deeper. From what you showed:

From the netstat log, only one connection has source port within range of (User) source port range configured in TsAgent (20000-57499).

TCP 172.30.2.121:23939 204.79.197.200:443     ESTABLISHED

The others are within the System Source Port range (57500-65499).

Either that single connection is the only logged-on user traffic at that time, or somehow the (User) source port allocation range not in effect?

Would you be able to open a Support case for this?

I'm afraid the user source range has not effect, on the other side, narrowing the System port allocation range doesn't help because all connections keep be source from it.

I was thinking about opening a case I've never opened one for non-hardware issues, is the procedure the very same? Because here, in Italy, we're not allowed (or at lease we've always been told so) to speak directly with PaloAlto Support, instead we must ask the distributor...

Do you think we can write to support@paloaltonetworks.com and make reference to this discussion? It would save a lot of time explaining...

You  may be forced to open a case with your distributor, but they can then open a case with Palo Alto Networks Support. I fear this issue needs some further investigation, so if you were to get a Support case going, you are right, it would be faster.

Also, yes, the procedure should be the same, to open a case for non hardware related issues. However, it may be best to consult your distributor as I am not privy to the contracts for Italy.

  • 10782 Views
  • 13 replies
  • 0 Likes
Like what you see?

Show your appreciation!

Click Like if a post is helpful to you or if you just want to show your support.

Click Accept as Solution to acknowledge that the answer to your question has been provided.

The button appears next to the replies on topics you’ve started. The member who gave the solution and all future visitors to this topic will appreciate it!

These simple actions take just seconds of your time, but go a long way in showing appreciation for community members and the LIVEcommunity as a whole!

The LIVEcommunity thanks you for your participation!