- Access exclusive content
- Connect with peers
- Share your expertise
- Find support resources
Click Preferences to customize your cookie settings.
Unlock your full community experience!
useful custom reports
- LIVEcommunity
- Discussions
- General Topics
- Re: useful custom reports
- Subscribe to RSS Feed
- Mark Topic as New
- Mark Topic as Read
- Float this Topic for Current User
- Printer Friendly Page
useful custom reports
- Mark as New
- Subscribe to RSS Feed
- Permalink
09-26-2017 11:44 PM
Hey all,
I want to create some custom reports to get more useful information about what is going on in my network.
I would like to know - just informational - which reports do you use in your daily business?
Respectively which reports you consider as useful.
Until now, I created one report that shows me the denied packets for every last week.
Can you give me some more hints?
Thank you!
- Mark as New
- Subscribe to RSS Feed
- Permalink
11-28-2017 01:55 AM - edited 11-28-2017 01:56 AM
For example, when I want to create a custom report with the spyware infected hosts:
How can I do this?
There aren't so much options..
- Mark as New
- Subscribe to RSS Feed
- Permalink
11-28-2017 10:20 AM
The spyware report is actually pulling from the Threat database, with the ( subtype eq spyware ) as the actor.
- Mark as New
- Subscribe to RSS Feed
- Permalink
08-15-2018 06:09 AM
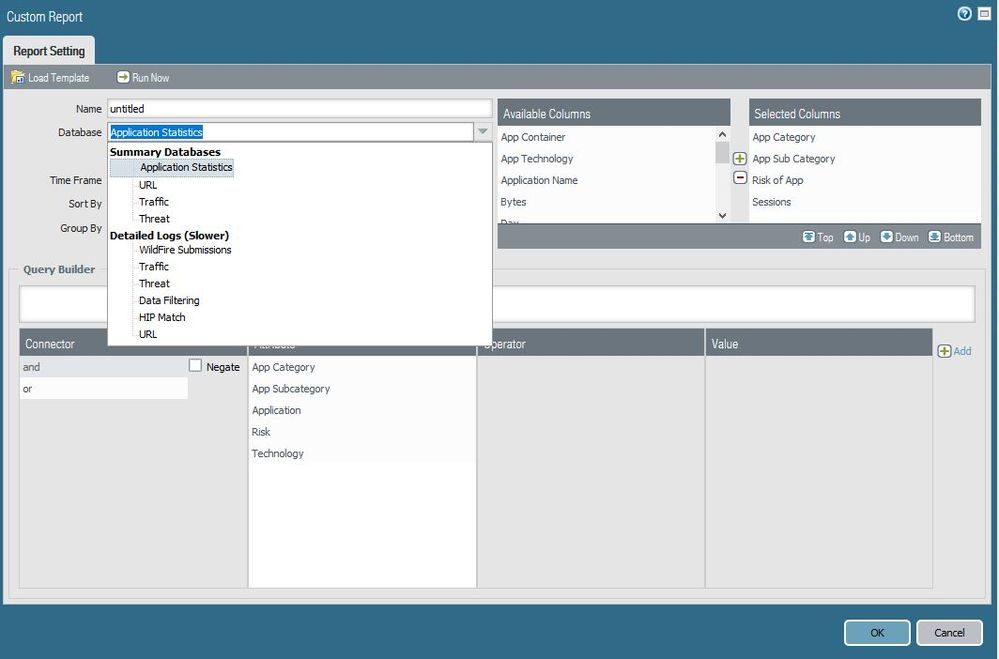
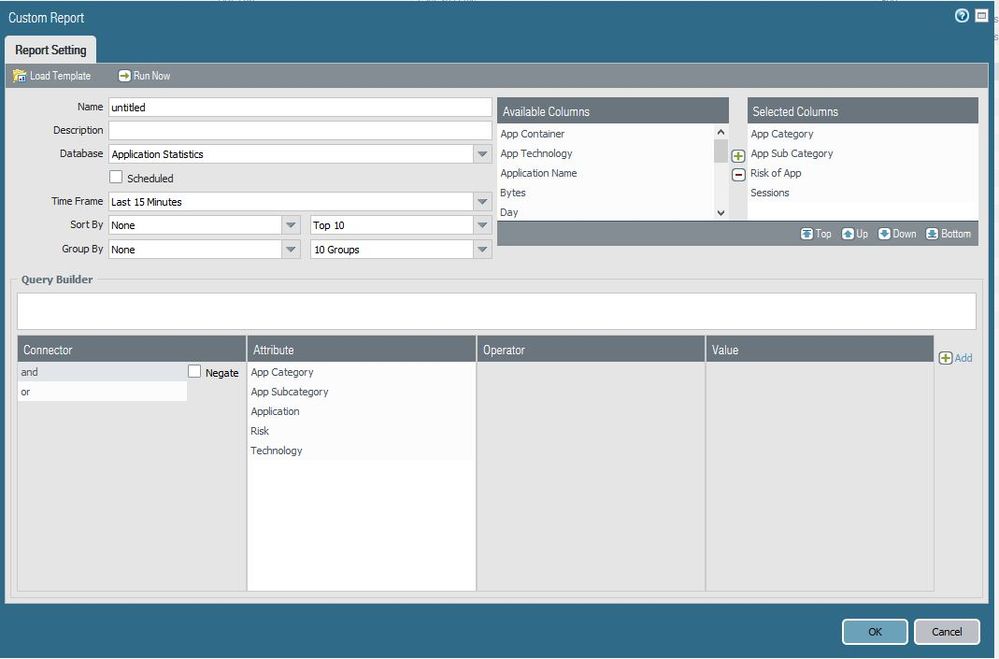
Hi, we can create custom reports as per our requirement, you could define the filters which you wish to observes the logs for like desti, zone, etc..One could define a time frame as well like daily, weekly and so on.
However I have a few questions that I still need ansewrs for :
1.) There is an option for grouping the traffic log reports based on destination etc.... There is a maximum limit of 500 logs only that it can produce logs for. Does that mean I get only 500 logs from the time of capture ? If I am right what happens to the traffic generated after that ? Is there a way to incerase the limit >500. Because a custome report on Panorama with a limit of 500 means nothing even if I capture hourly.
- Mark as New
- Subscribe to RSS Feed
- Permalink
08-15-2018 06:38 AM
It's the top 500 logs depending on whatever your sort criteria be. So if I use bytes for example, it's the TOP 500 logs as determined by the amount of bytes logged. If you are combining a 'Sort By' and 'Group By' operating within the same request you'll be limited to the Top 500 logs; however if you remove the 'Group By' you have access to as much as the Top 10,000 logs.
You have to get creative in the way you generate the reports so that the report actually gives you what you are looking for. I've yet to want to run any report that I wasn't able to work around these limitations in some way or another.
I know that there are multiple FRs to increase this capability if you want to reach out to your SE and add your vote to those requests.
- Mark as New
- Subscribe to RSS Feed
- Permalink
08-15-2018 07:14 AM
Hi @BPry
Thank you for the reply, after some thought your post made sense. I am still getting to know how the SORT BY and GROUPEDBY work in conjunction with eachother in generating reports. any explanantion in that direction will be helpful. Is there any detailed documentation with examples where I can refer for further learning. Thank you
- Mark as New
- Subscribe to RSS Feed
- Permalink
12-10-2018 03:02 AM - edited 12-10-2018 03:05 AM
@BPryI'm still overwhelmed.
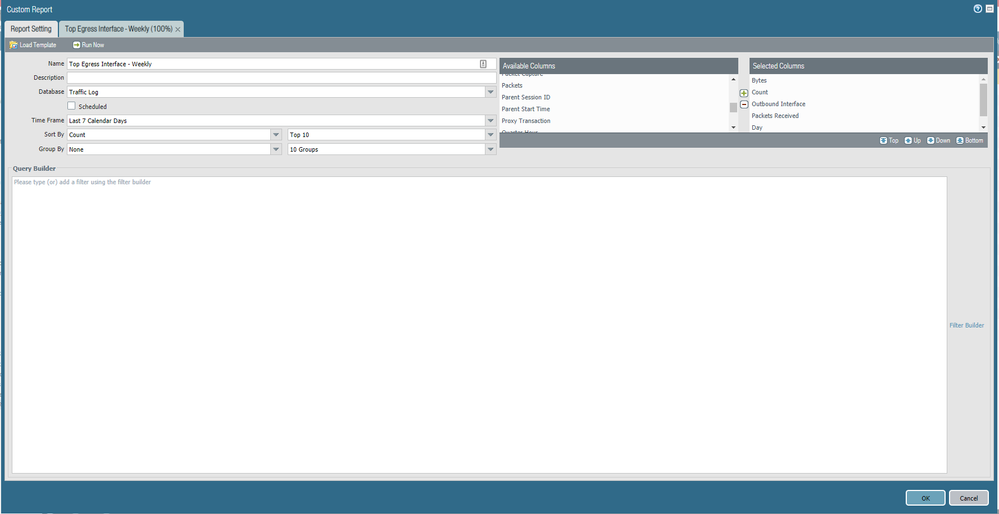
There is that top egress interfaces report that shows all interfaces and the bytes which were transmitted.
How can I create a custom report for that, but not for one day, but for a whole week? To see the weekly amount of bytes of my interfaces.
- Mark as New
- Subscribe to RSS Feed
- Permalink
12-11-2018 10:18 AM

- 11866 Views
- 21 replies
- 0 Likes
Show your appreciation!
Click Accept as Solution to acknowledge that the answer to your question has been provided.
The button appears next to the replies on topics you’ve started. The member who gave the solution and all future visitors to this topic will appreciate it!
These simple actions take just seconds of your time, but go a long way in showing appreciation for community members and the LIVEcommunity as a whole!
The LIVEcommunity thanks you for your participation!
- False Positive Report in VirusTotal
- EDL Capacity Reached but Lists Show Empty / Default Entry (0.0.0.0/32) – Panorama Multi-VSYS Setup Post: in General Topics
- Domain static.hexoutputs.tech is being reported as hosting Malware in VirusTotal
- New reports On-Demand BPA in Strata Cloud Manager
- Restrict access via GlobalProtect to permit access to only a specific Google Drive Account/Folder in GlobalProtect Discussions


