- Access exclusive content
- Connect with peers
- Share your expertise
- Find support resources
Click Preferences to customize your cookie settings.
Unlock your full community experience!
Panorama sessions in ACC view show much higher session counts than the session count on the firewall
- LIVEcommunity
- Discussions
- Network Security
- Panorama Discussions
- Panorama sessions in ACC view show much higher session counts than the session count on the firewall
- Subscribe to RSS Feed
- Mark Topic as New
- Mark Topic as Read
- Float this Topic for Current User
- Printer Friendly Page
Panorama sessions in ACC view show much higher session counts than the session count on the firewall
- Mark as New
- Subscribe to RSS Feed
- Permalink
04-27-2023 07:16 AM
Hi all, a bit of a mystery one here. can anyone explain this?
For example, "show session info" on the firewall cli and Dashboard GUI currently shows about
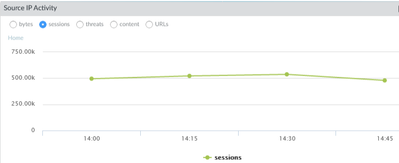
but in Panorama under ACC
We're showing more like 500,000 connections!?!?!?
Can anyone explain this?
Thanks in advance
- Mark as New
- Subscribe to RSS Feed
- Permalink
04-29-2023 03:38 PM
Hello @timspenc
thanks for posting!
Have you used Device Name filter under ACC to limit the logs only to a single Firewall?
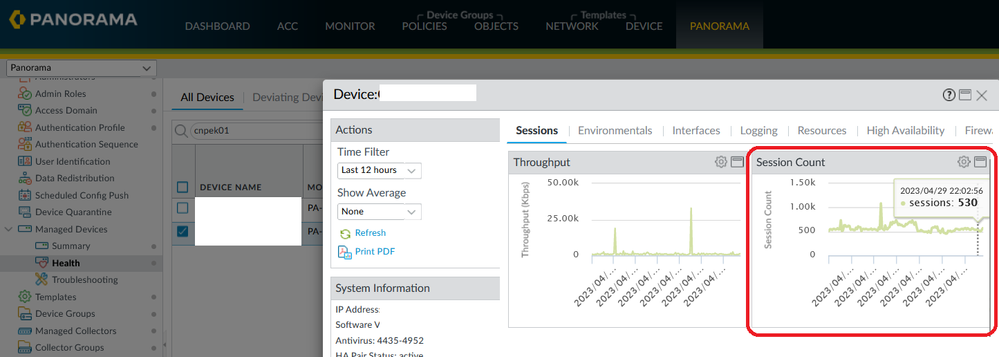
Also, could you check the session count from Health under: Panorama > Managed Devices > Health > [Select Firewall] > Sessions > Session Count. This will give you more accurate information about number of sessions over time depending on Time Filter defined under Actions.
Kind Regards
Pavel
- Mark as New
- Subscribe to RSS Feed
- Permalink
05-02-2023 01:17 AM
Thankyou for your response @PavelK
I've looked at your suggestions to see if they help.
I thought you might be right about listing just the one firewall in Panorama however it didn't help.
Even if I log on to the Active firewall and check ACC there we see lots of sessions as below.
and yet when I check the health status over the same 12 hour timeframe, we see the real amounts
I didn't know about those graphs under health before so it was good to learn of those. Thank you.
I just wish I could understand why the ACC tabs in both the firewall and Panorama do not correlate with what the firewalls are actually doing??
Do other peoples graphs show the correct info for sessions??
- 2860 Views
- 2 replies
- 0 Likes
Show your appreciation!
Click Accept as Solution to acknowledge that the answer to your question has been provided.
The button appears next to the replies on topics you’ve started. The member who gave the solution and all future visitors to this topic will appreciate it!
These simple actions take just seconds of your time, but go a long way in showing appreciation for community members and the LIVEcommunity as a whole!
The LIVEcommunity thanks you for your participation!
- How to push Bulk IOC list in file format to panorama firewall? in Panorama Discussions
- IoT Devices in Panorama in Panorama Discussions
- SCM Device Restart Incidents — False Positive Notification in Strata Cloud Manager
- Firwall is uable to send logs to the Panorma (Log collector is showing inactive) in Next-Generation Firewall Discussions
- No way to use target to send an op command to a firewall from Panorama using the supported Ansible modules? in Panorama Discussions


