- Access exclusive content
- Connect with peers
- Share your expertise
- Find support resources

Older PAN-OS had a purging logic which was checked against the logdb quota and the predefined quota size for reports. Oldest logs were deleted whenever a quota was reached until we reached the configured quota size for the given log type.
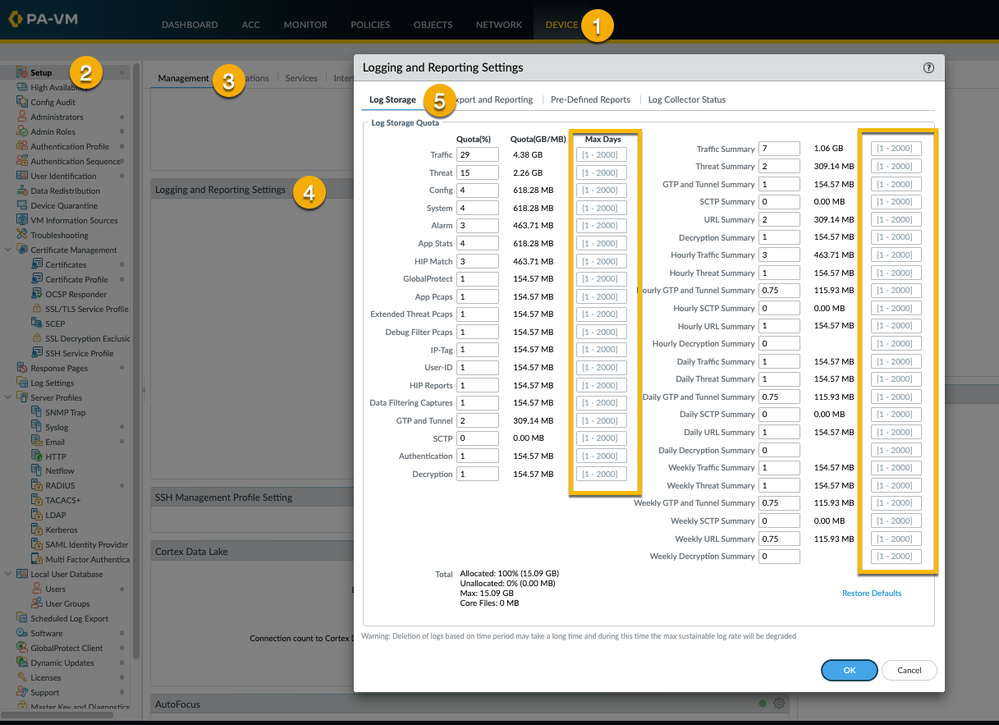
We've grown since the olden days and a feature using 'Max Days' was added. This allows you to configure an age-out period for each and every log type and all reports and adds more control to your expiration/retention.
You can find this setting under Device/Panorama tab (1) > Setup (2) > Management (3) > Logging and Reporting setting (4) > Log Storage tab (5)

The range can vary from one to 2,000 days across all platforms. The firewall or Panorama appliance automatically deletes logs that exceed the specified period. By default, there is no expiration period, which means logs never expire. The appliance evaluates logs during creation of the logs and then deletes logs that exceed the expiration period or quota size.
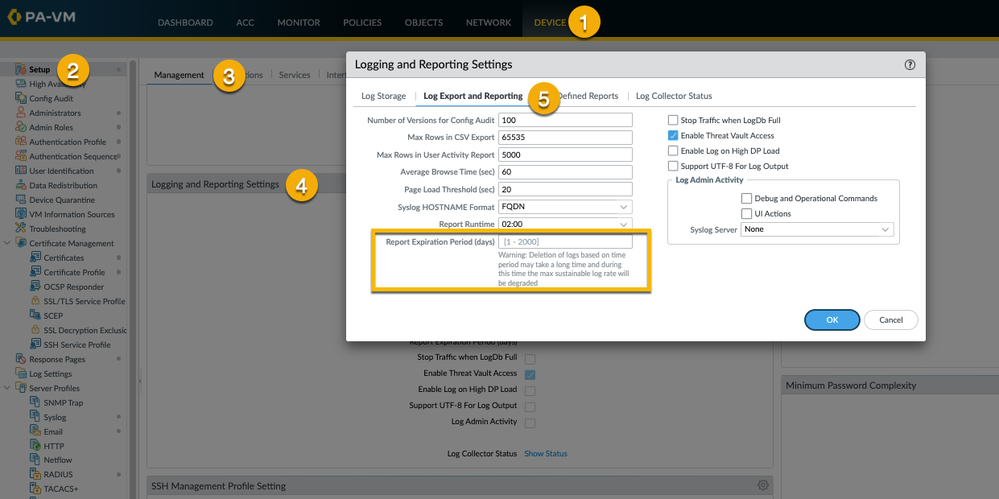
For reports, you will find a similar setting under Device/Panorama tab (1) > Setup (2) > Management (3) > Logging and Reporting setting (4) > Log Export and Reporting tab (5).

This sets the expiration period (in days) for reports (also here the range is 1 to 2000). By default, there is no expiration period, which means reports never expire. The appliance deletes expired reports nightly at 2 A.M. according to its system time.
Prefer CLI ? No problem!
You can use CLI commands to configure an expiration period or review the current retention time:
# set deviceconfig setting management quota-settings log-expiration-period <log type> <number of days>
Where "log type" = traffic / threat / trsum / etc...
Where "number of days" = 1-2000
# set deviceconfig setting management report-expiration-period <number of days>
Where "number of days" = 1-2000
admin@PA-VM> show system logdb-quota

Quotas:
              system: 4.00%, 0.629 GB Expiration-period: 0 days
              config: 4.00%, 0.629 GB Expiration-period: 0 days
               alarm: 3.00%, 0.472 GB Expiration-period: 0 days
             appstat: 4.00%, 0.629 GB Expiration-period: 0 days
         hip-reports: 1.00%, 0.157 GB Expiration-period: 0 days
             traffic: 30.00%, 4.716 GB Expiration-period: 0 days
              threat: 16.00%, 2.515 GB Expiration-period: 0 days
               trsum: 7.00%, 1.100 GB Expiration-period: 0 days
         hourlytrsum: 3.00%, 0.472 GB Expiration-period: 0 days
          dailytrsum: 1.00%, 0.157 GB Expiration-period: 0 days
         weeklytrsum: 1.00%, 0.157 GB Expiration-period: 0 days
              urlsum: 2.00%, 0.314 GB Expiration-period: 0 days
        hourlyurlsum: 1.00%, 0.157 GB Expiration-period: 0 days
         dailyurlsum: 1.00%, 0.157 GB Expiration-period: 0 days
        weeklyurlsum: 1.00%, 0.157 GB Expiration-period: 0 days
               thsum: 2.00%, 0.314 GB Expiration-period: 0 days
         hourlythsum: 1.00%, 0.157 GB Expiration-period: 0 days
          dailythsum: 1.00%, 0.157 GB Expiration-period: 0 days
         weeklythsum: 1.00%, 0.157 GB Expiration-period: 0 days
              userid: 1.00%, 0.157 GB Expiration-period: 0 days
               iptag: 1.00%, 0.157 GB Expiration-period: 0 days
   application-pcaps: 1.00%, 0.157 GB Expiration-period: 0 days
             extpcap: 1.00%, 0.157 GB Expiration-period: 0 days
  debug-filter-pcaps: 1.00%, 0.157 GB Expiration-period: 0 days
            dlp-logs: 1.00%, 0.157 GB Expiration-period: 0 days
            hipmatch: 3.00%, 0.472 GB Expiration-period: 0 days
                 gtp: 2.00%, 0.314 GB Expiration-period: 0 days
              gtpsum: 1.00%, 0.157 GB Expiration-period: 0 days
        hourlygtpsum: 0.75%, 0.118 GB Expiration-period: 0 days
         dailygtpsum: 0.75%, 0.118 GB Expiration-period: 0 days
        weeklygtpsum: 0.75%, 0.118 GB Expiration-period: 0 days
                auth: 1.00%, 0.157 GB Expiration-period: 0 days
                sctp: 0.00%, 0.000 GB Expiration-period: 0 days
             sctpsum: 0.00%, 0.000 GB Expiration-period: 0 days
       hourlysctpsum: 0.00%, 0.000 GB Expiration-period: 0 days
        dailysctpsum: 0.00%, 0.000 GB Expiration-period: 0 days
       weeklysctpsum: 0.00%, 0.000 GB Expiration-period: 0 days

Disk usage:
traffic: Logs and Indexes: 20K Current Retention: 0 days
threat: Logs and Indexes: 20K Current Retention: 0 days
system: Logs and Indexes: 8.1M Current Retention: 779 days
config: Logs and Indexes: 45M Current Retention: 779 days
alarm: Logs and Indexes: 20K Current Retention: 0 days
trsum: Logs and Indexes: 912K Current Retention: 0 days
hourlytrsum: Logs and Indexes: 464K Current Retention: 0 days
dailytrsum: Logs and Indexes: 96K Current Retention: 0 days
weeklytrsum: Logs and Indexes: 8.0K Current Retention: 0 days
thsum: Logs and Indexes: 912K Current Retention: 0 days
hourlythsum: Logs and Indexes: 464K Current Retention: 0 days
dailythsum: Logs and Indexes: 96K Current Retention: 0 days
weeklythsum: Logs and Indexes: 8.0K Current Retention: 0 days
appstatdb: Logs and Indexes: 20K Current Retention: 0 days
userid: Logs and Indexes: 16K Current Retention: 0 days
iptag: Logs and Indexes: 16K Current Retention: 0 days
hipmatch: Logs and Indexes: 20K Current Retention: 0 days
hip-reports: Logs and Indexes:  Current Retention: 0 days
extpcap: Logs and Indexes: 16K Current Retention: 0 days
urlsum: Logs and Indexes: 908K Current Retention: 0 days
hourlyurlsum: Logs and Indexes: 464K Current Retention: 0 days
dailyurlsum: Logs and Indexes: 96K Current Retention: 0 days
weeklyurlsum: Logs and Indexes: 8.0K Current Retention: 0 days
gtp: Logs and Indexes: 16K Current Retention: 0 days
gtpsum: Logs and Indexes: 908K Current Retention: 0 days
hourlygtpsum: Logs and Indexes: 464K Current Retention: 0 days
dailygtpsum: Logs and Indexes: 96K Current Retention: 0 days
weeklygtpsum: Logs and Indexes: 8.0K Current Retention: 0 days
auth: Logs and Indexes: 16K Current Retention: 0 days
sctp: Logs and Indexes: 16K Current Retention: 0 days
sctpsum: Logs and Indexes: 908K Current Retention: 0 days
hourlysctpsum: Logs and Indexes: 8.0K Current Retention: 0 days
dailysctpsum: Logs and Indexes: 8.0K Current Retention: 0 days
weeklysctpsum: Logs and Indexes: 8.0K Current Retention: 0 days
application: Logs and Indexes: 4.0K Current Retention: 0 days
filters: Logs and Indexes: 4.0K Current Retention: 0 days
dlp: Logs and Indexes: 4.0K Current Retention: 0 days
hip_report_base: Logs and Indexes: 1.1M Current Retention: N/A
wildfire: Logs and Indexes: 40K Current Retention: N/A

Space reserved for cores:       0MB
"Expiration-period: 0 days" means that you kept the default value. So there's no expiration configured.
"Current Retention: X days" means that the oldest available log is one from X days ago. All logs older than X days are purged.
Feel free to share your questions, comments and ideas in the section below.
Thank you for taking time to read this blog.
Don't forget to hit the Like (thumbs up) button and to Subscribe to the LIVEcommunity Blog area.
Kiwi out!
You must be a registered user to add a comment. If you've already registered, sign in. Otherwise, register and sign in.
| Subject | Likes |
|---|---|
| 3 Likes | |
| 2 Likes | |
| 2 Likes | |
| 2 Likes | |
| 2 Likes |


