This blog written by Peter Kirubakaran N.
SLO as a Service
In the realm of SaaS, understanding and effectively implementing Service Level Agreements (SLA), Service Level Objectives (SLO), and Service Level Indicators (SLI) are pivotal to enhancing the reliability and performance of services. In this blog post, we delve into these key concepts and explore how Core Infrastructure and Platform Engineering (CIPE) is going to revolutionize service reliability with its SLO as a Service (SLOaaS) offering as part of the Garuda platform.
What is SLA , SLO , SLIs etc.?
In essence, SLI is the metric being measured, SLO is the target or goal set based on SLIs, and SLA is the overall agreement that includes SLOs and other terms defining the relationship between the service provider and the customer. These concepts are crucial in managing and improving the reliability and performance of service(s).
Why SLO?
The ubiquity of SLI and SLI-based alerts can lead to alert fatigue, obscuring alerts that genuinely impact customers. For instance, distinguishing between a Pod crash loop where there are 100+ replicas active vs a database write replica in crash loop impacting ingestion highlights the importance of aligning alerts with customer impact.
SLO Types:
SLOs are of various types and identifying the right fit to get the best result plays the key role. Let's look at some commonly used SLO types.
- Event Based: Generally, metrics based SLOs are based on total events to bad events.
- Example : HTTP API total event = 1000 and has bad events (500,429’s etc ) = 100 then the SLO of the service = 90%
- Uptime Based: Like the name suggests, uptime based SLOs are defined based the service being up (good) vs service is not up but not necessarily takes into account on the service performance
- Synthetic Based: SLO defined based on the synthetic monitoring metrics.
- e.g A test production tenant’s performance SLIs are used to derive the SLO than using the SLI of the entire system.
How to Identify SLOs?
It is best to start with defining SLOs for the workflows of a product that are customer facing.
In case of Garuda or any observability platform some of the customer facing workflows will be:
- Data Ingestion
- Querying
- Alert / Recording Rules creation
- Grafana / Frontend availability
There could be various moving components within these but defining what will be SLO’s for these components and the overall SLA based on this will be a good place to start.
What are the difficulties with defining SLOs:
- While Certain SLO’s are easy to identify as the default metrics (e.g HTTP API req or latency) gives the needed data, but certain customer facing workflows may not have a direct metric that has good vs bad events so as to define SLO (e.g Ingestion performance that depends on Queuing, Ingress and various ingestion components)
- User Impact vs being within the SLO defined:
- Let's take a scenario of having SLO as 99.9 and having an error budget of has an allowed downtime of 8.77 hours in a year and if a service is up throughout the year and one fine day it's down continuously for 8 hours may have more impact than a service having shorter downtimes.
- Another case is, a service being down for 5 mins in a day than being down 5 one minute window over the last half an hour may have a bad user experience based on the product.
- Yet another scenario is a service being down for 10 mins during the peak hours will impact more than a service being down during non-peak hours.
SLO as a Service:
Now that we have understood the key terminologies and How to identify the SLOs and the difficulties with SLOs, let's look at SLO as a Service offering from CIPE that aids in SLO creation while also helping with minimizing the pitfalls with SLO.
Architecture:
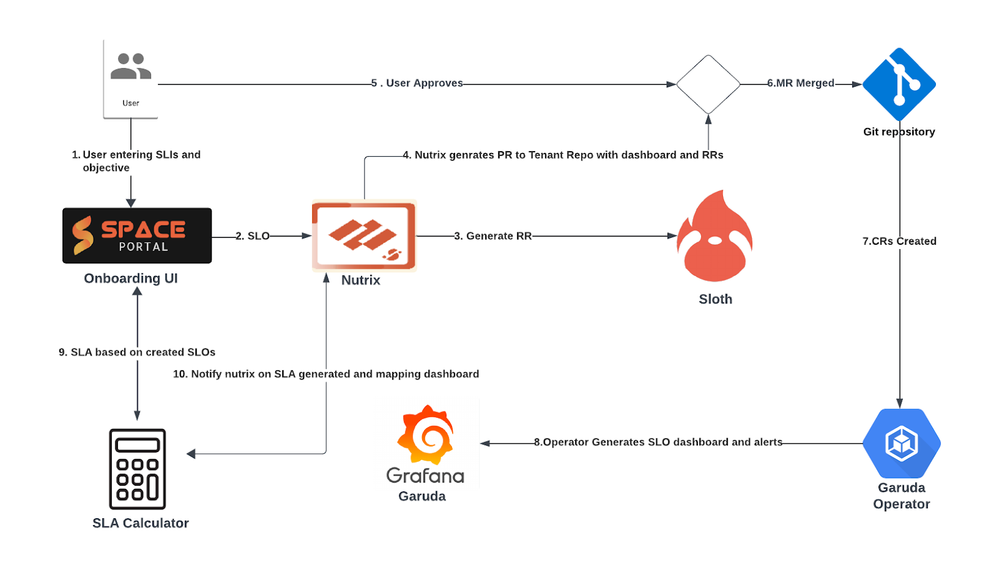
 SLO Architecture
Components:
- Onboarding UI: Space portal will have a plugin where users can pass on the SLIs and Objective details.
- RR & Alert Generator: RR Generator is based on sloth that helps in generating recording rules, Alerts for burn rate, error budget etc and also takes the tenants context and passes on to Nutrix.
- Nutrix: A workflow engine helps in generating a Dashboard based on the RR generated and also creates an auto MR to Tenant’s repo having RRs and Dashboard json.
- Garuda Operator: Garuda operator is capable of listening to these CRs and create the RRs, Alerts and Dashboards in Tenant’s Grafana org.
- SLA Calculator: This service provides the ability to add weightage to SLOs based on time of the day, based on the work flow criticality and drive the SLA for the whole product.
User Flow:
Define the identified metric as yaml or via the UI in Space Portal.
slo_name: “requests-availability”
objective: 99.9
description: “Common SLO based on availability for HTTP request”
Labels:
category: availability
Sli:
Events:
error_query: sum(rate(http_request_duration_seconds_count{job=”myservice”,code=~”(5..|429)”}[{{.window}}]))
total_query:
sum(rate(http_request_duration_seconds_count{job=”myservice”}[{{.window}}]))
- Recording rule & Alert creation
- Once the SLO is defined and onboarded the repo, a Auto MR will be raised to the repo having all the recording rules created based on the SLO defined.
- Also relevant dashboards will be pushed into the repo.
- Deploying:
- On-Merging the MR, Gitops will create the SLO recording rules and dashboard in Grafana.
- Visualization:
- Now, you will be able to access the SLO dashboard in Garuda.
- Optional:
- CIPE's SLOaaS allows for customization by providing a custom metric template, enabling users to create and integrate custom metrics into their SLOs.
Examples:
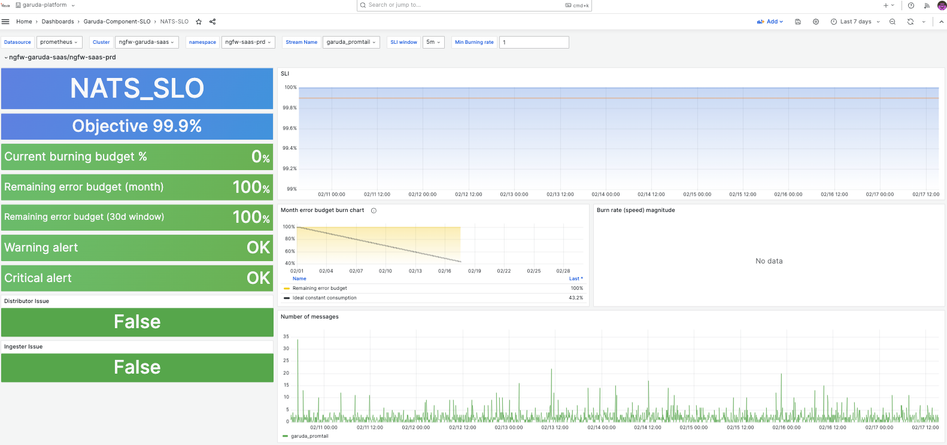
Garuda’s SLO Dashboard
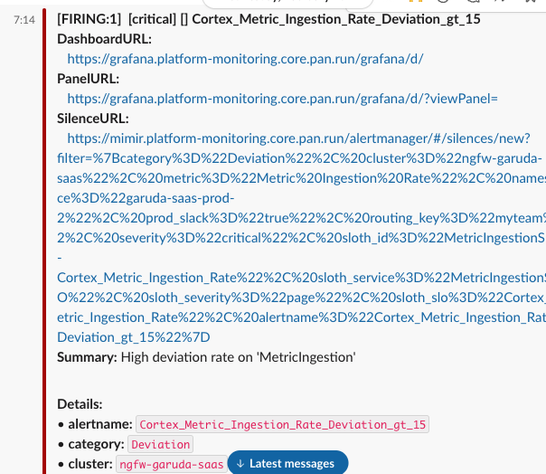
Automatic notification based on SLO
Impact:
- SLOaaS aids yours in creating custom metrics and thereby giving flexibility to track customer facing impact for those scenarios for which direct metric is not available.
- Ease of onboarding through GitOps.
- Visualization of burn rate and error budget over a month and over selected period in time to give insights on breaches of slo to know frequency, time of the day etc.
- Weightage based SLA calculation to reflect the actual severity between SLOs.
Conclusion:
In conclusion, the implementation of SLOs through CIPE's SLOaaS is a powerful tool for tracking product stability and reducing alert fatigue. It not only provides a comprehensive view of service reliability but also equips decision-makers with the data needed to make informed choices regarding new feature introductions to the product. As service reliability becomes increasingly critical, embracing SLOaaS is a strategic move towards ensuring seamless and reliable user experiences.
Garuda Team Members:
- Peter Kirubakaran N
- Herdesh Verma
- Puneet Gupta
- Ramesh Nampelly
- Pradeepkumar Vijaya Kumar
