- Access exclusive content
- Connect with peers
- Share your expertise
- Find support resources
Click Preferences to customize your cookie settings.
Unlock your full community experience!
DTRH: CIS Benchmarking - 3rd Party Data Ingestion | Data Parsing | Widgets & Dashboards
- LIVEcommunity
- Discussions
- Security Operations
- Cortex XDR Discussions
- DTRH: CIS Benchmarking - 3rd Party Data Ingestion | Data Parsing | Widgets & Dashboards
- Subscribe to RSS Feed
- Mark Topic as New
- Mark Topic as Read
- Float this Topic for Current User
- Printer Friendly Page
DTRH: CIS Benchmarking - 3rd Party Data Ingestion | Data Parsing | Widgets & Dashboards
- Mark as New
- Subscribe to RSS Feed
- Permalink
08-04-2022 10:54 AM - last edited on 04-18-2024 12:33 PM by emgarcia
DTRH: CIS Benchmarking
3rd Party Data Ingestion | Data Parsing | Widgets & Dashboards
Overview
In this DTRH we will look at adding valuable data into XDR from performing CIS Benchmarking across systems. Even outside of CIS Benchmarking data, customers are looking to bring data (telemetry, alerts, logs, …) into the Cortex Data Lake and XDR provides a number of different ways to achieve this. In the previous DTRH: Scripting and Reaping Data we described how to bring in file content data in using scripting, which is a similar concept to what we will do here but let’s look closer at 3rd party tools with more structured data and dive into how we can get more value out of it. Currently XDR has native support for some most of the large cloud providers, some 3rd party technology, and also has the ability essentially take in any data source with our data ingestion and parsing. This data is stored int the data lake in different indexes and can be used for threat hunting searches, behavioral indicator of compromise alerts, addition detection analytics through machine learning, dashboards…the list goes on! In this DTRH we are going to take a 3rd party tool, CIS-CAT Pro from the Center of Internet Security and use Cortex XDR to perform benchmark tests across the infrastructure, collect that data and stored in usefully in Cortex XDR so that we can get informative dashboards on status and look at the reports from all systems.
CIS Benchmark
The Center for Internet Security is a nonprofit entity whose mission is to 'identify, develop, validate, promote, and sustain best practice solutions for cyberdefense. It draws on the expertise of cybersecurity and IT professionals from government, business, and academia from around the world. To develop standards and best practices, including CIS benchmarks, controls, and hardened images, they follow a consensus decision-making model. CIS benchmarks are configuration baselines and best practices for securely configuring a system. Each of the guidance recommendations references one or more CIS controls that were developed to help organizations improve their cyberdefense capabilities. CIS controls map to many established standards and regulatory frameworks, including the NIST Cybersecurity Framework (CSF) and NIST SP 800-53, the ISO 27000 series of standards, PCI DSS, HIPAA, and others.
Implementation
In this section we will cover how to implement this integration. In each of the steps there will be additional information to highlight related areas of the product. The overall procedure to set this up will follow these steps.
- Ensuring pre-requisites are done
- Adding the HTTP collector to receive data
- Adding a script that call the CIS binaries with the right benchmark file
- Parsing the data received by the collector
- Creating XQL searches , widgets and dashboards
1.Pre-requisites
- The XDR agent is installed on the system
- CIS binaries are installed on the system
- The appropriate benchmark file is stored on the system
2.Third Party Data Ingestion
There are a variety of ways to ingest data into XDR to make available in the data lake. For the purpose of this document, we will use the HTTP Collector but the same data could onboarded using any of the methods defined below.
HTTP Collector
The HTTP collector is a HTTP listener that resides on the XDR server. One of the main benefits is ease of use. It is easy to spin up several collectors in the UI and does not require any additional hardware or software.
XDR Collector
The XDR Collector can actually be implemented a number of different ways in XDR. There are several features of the XDR Collector but in regards to this use case, it can be used to collect and transmit data to XDR. The benefit is that there is lot of different features where the XDR Collector can get additional telemetry.
API
The API provides a programmatical way of getting data. This typically is going to require someone with a DevOps skillset. One benefit of the API is that it can be implemented in 3rd party technologies directly if they provide that type of integration.
BrokerVM
The BrokerVM is the companion technology to XDR that allows for increased functionality typically around network architecture and log capture. BrokerVM is, as it name suggests, a virtual machine that includes several log capture methods such as syslog, Kafka and remote file CSV. The additional log transport mechanisms are the main value of the BrokerVM and the ability to configure on premise often times helps in the design of a secure transport to the cloud.
Use the following steps to setup the HTTP Collector:
- Navigate to Settings-> Data Collection -> Custom Collectors
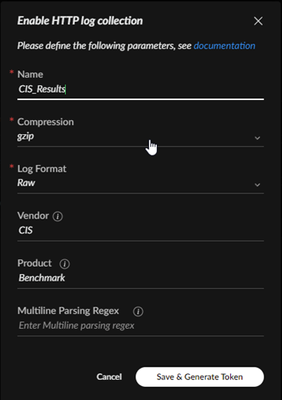
- In the HTTP section, select “+ Add Instance” and set the following fields
- Name – This is an arbitrary name used for storing, choosing something that identifies the source is good way to differentiate between different collectors
- Compression – This field will define how the data is being received at the collector, in our case it will be uncompressed
- Log Format – The field will define the format of the data being received. In cases where the data is in CEF or LEEF format , the XDR system can do automatic parsing. In our case we are going to be receiving ‘raw’ data and we will then define a parser later
- Vendor – Set the vendor of the product that created the data. While this could be arbitrary its important to note that this field will be the first part of the dataset name and using the actual vendor, CIS in this case, will help identify the datasets
- Product - Set the product to be the actual product of the vendor, this will be the 2nd part of the data set name so the naming is important in identification, in this case the product from CIS is call CAT
- Multiline Parsing Regex – this is needed when multiple events may be included in a single line event. It is not needed for our example.
- Your configuration should look something like this:
- Click ‘Save & Generate Token’
- Copy and save the HTTP token that will be used to access this collector. After you click ‘Done’ this token will no longer be available so make sure you have saved the token, it will be used again later.
- Click on the 3 dots on the right and record the API URL, you will use this later along with the previous token
3. Scripting CIS Execution
A script was created (and should be available with this doc) to execute the CIS executables, called CIS-CAT, that will run the assessment tool against the benchmark file. There are some items hardcoded into the script that will need to be changed to work in a different environment. We will cover those items here but for a deeper dive into scripting and receive data, see the previous Down The Rabbit Hole: Scripting Anything and Reaping Data found here:
Script Onboarding
The variables for the API URL and API token can be hardcoded into the script or you can define them as parameters that get passed in when the script is run from the Action Center.
* Optional API Info Passing From Server*
While scripts live a short life on the system and are transferred over encrypted channels . It is typically not best practice to hard code credentials into code. The other option is to have the defined variables we just mentioned would be deleted as hardcoded values and set as parameters that would be passed in by changing the run function to include the same exact variable names (apiurl, apikey). The difficulty here is you would have to always have access to the apikey to run the script.
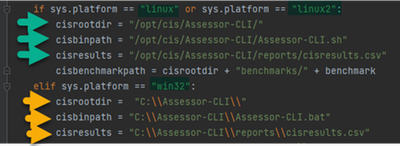
There are 6 variables that will need to be changed to match your CIS directory (variable cisrootdir) , the Assessor-CLI start script (variable cisbinpath) and the results file (cisresults) of the run.( Do not change cisbenchmarkpath) You may have noticed I said 6 variables but only mentioned 3. This is because we run the script on both Windows and Linux and they have very different paths so we set these 3 variables with the same name for each of these 2 distros. This enables us to reuse the same script. Portion of the code is shown below with the if/else statements that set these values. Green arrows mark the variables you need to change for Linux and Yellow are for Windows.
Once all the values are set , the script can be added to the script library.
Navigate to: Response -> Action Center -> Agent Script Library
Click ‘+ New Script’
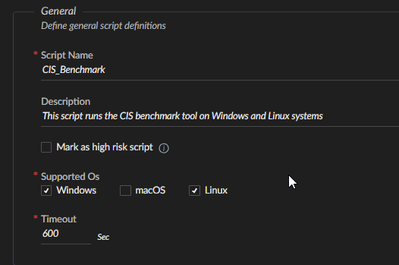
Fill in the General information section. The script name is required and should be a name that helps you see the script in the action center, CISBenchmark works well. The description is option but it’s a good way of sharing what the script does with other users on the system. Supported OS’s should have Windows and Linux checked. And the default timeout of 600 is a good amount of time to use.
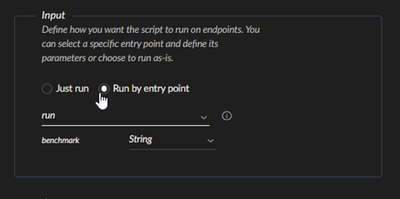
The input section asks whether the script should run in whole or start with an entry point function. In this case we have a function name run as the entry point and we select that. From the code itself, it will determine if there are any values that are passed into the defined run function. In our case we are passing in the name of the benchmark file we want to run against. NOTE: It is expected that this benchmark file resides off the root CIS directory we set above in the benchmarks folder.
*Optional API Info Passing From Server*
If you wish to pass the API URL and API token, it would require that the variables were added to the run function, this would then set 3 variables we could define in the input section. These variables would be benchmark, apiurl, and apikey and all should be defined as String.
Script Execution
Now that the script is added to the XDR console and we have defined the parameters for the script to be able to run, the next step is to actually run the script.
- Navigate to: Incident Response -> Action Center -> All Actions
- Click on ‘+New Action’ in the top right corner
- Select ‘Run Endpoint Script’
- From scripts select the name you gave it, in this example it is CISBenchmark
- In Benchmark(String) you will manually add the name of the benchmark file you with to run. It is important to note that each version of each operating system has their own specific benchmark file that is only applicable to that OS and that version
- Click ‘Next’ in the bottom right corner
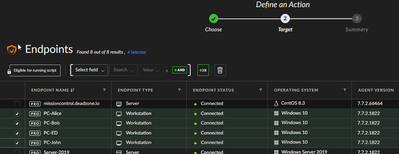
2. Select the Endpoint where you want the script to run. Remember the endpoint OS and version must match the benchmark file that the script is being run against
- Click ‘Next’ on the bottom right corner
- On this last screen verify all the information is correct
- Click ‘Run’ in the bottom right hand corner
4. Parsing
Parsing is a property of the system where data that is being ingested will pass through the parser and different actions can be taken on this data. A typical action would be to take the data and store the values under field names that are easily identifiable but there are several other tasks that can be done with the parser:
- Remove unused data that is not required for analytics, hunting, or regulation.
- Reduce your data storage costs.
- Pre-process all incoming data for complex rule performance.
- Add tags to the ingested data as part of the ingestion flow.
- Easily identify and resolve Parsing Rules errors with error reporting.
Test your Parsing Rules on actual logs and validate their outputs before implementation.
For more detailed information on creating parsing rules see the online documentation here:
The goal for this section today is to provide some additional tips on how to use parsers for extracting and storing data. We will start looking at the parser from a XQL only stand point but we will later apply it to parsing rules used in Data Management. Lets being by going over 3 of the main function types that are commonly used.
JSON Extraction
The first function is json_extract. As the name suggests , this function will extract the value from the fields inside of json. The top level of json is defined with a $ and then we use the field names to extract down the path. So if this was the json:
{
"a_field" : "This is a_field value",
"b_field" : {
"c_field" : "This is c_field value"
}
}
A path to extract the value of c_field would look like: $.b_field.c_field
Regex Extraction
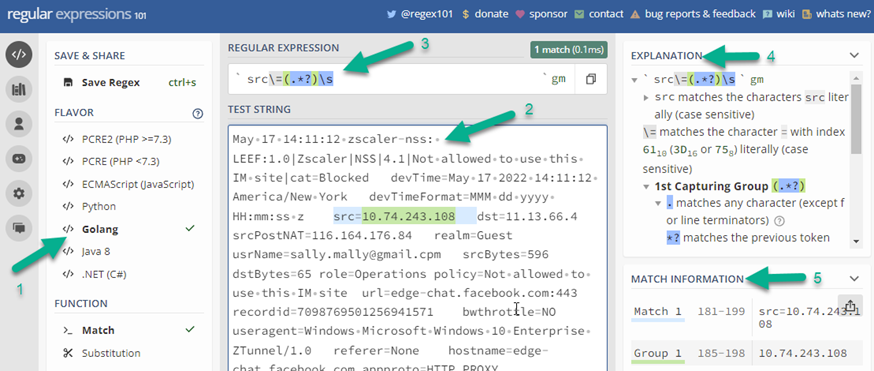
The second function commonly used for extraction is regextract. This can be a little more challenging then json_extract if you do not have familiarity with regex in general. The regex function used in XQL are based off GoLang Regex. The website regex101.com can be very useful in working with data and creating the actual regex that would be used in the XQL regextract query. Take a look at this data being extracted from a Zscaler log, in this case we are trying to extract the value from the src field:
- Flavor – Set this to Golang to match the regex in XQL
- Test String – This is the raw data going into the Cortex Data Lake, often times the raw data is found in the _raw_log field
- Regular Expression – this is the regex to extract and it will be the same used in regextract XQL function
- Explanation – gives details on the regular expression you created
- Match Information – will show you the match(s) of your regex
Once you the desired regex has been created, we can use it in XQL to extract the field. The XQL using the previous example would look like:
src=arrayindex(regextract(_raw_log, " src\=(.*?)\s "),0)
Split
The third way in which we will look at extracting data is with the split command. The split command is very easy to work with but it does require that the data being parsed is using a common delimiter. Fields are then extracted by taking the values between delimiters. Often times the values itself have no defining field names, so it may require understanding this log format. The data we are getting back from the CIS benchmark test are comma separated, so in this case the split function works well. Here is a raw log sample of the CIS data:
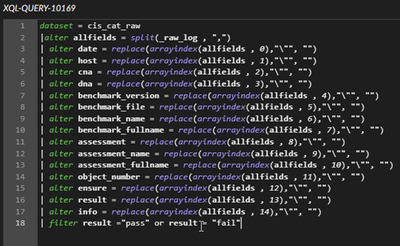
With the split command we separate this data into the 14 different values shown. This will be the basis for our parser. The data is stored in a text array , in this case here we used the name allfields for the array. Since all the fields are in a specific order, that is document in the CIS manual it was very easy to assign these fields the same names used by CIS:
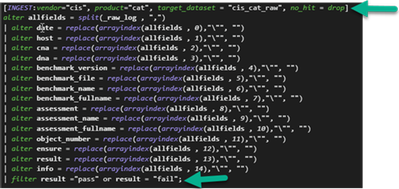
We now have all the data being parsed in the XQL builder as seen here, this is great but we do not want to have to use this same parsing query every time we want to access fields of the data so we create this as a parsing rule that massages the data on ingestion. One of the nice features of the Parsing Rules in XDR is that they use most of the same exact XQL syntax but we just need to make a few changes to use this as data manipulator rather than a data searcher. Parsing is performed in the XDR interface in : Settings -> Data Management -> Parsing Rules The 2 changes are marked below with green arrows.
The bottom arrow points to a semi-colon which is a requirement in the parsing rule.
The top arrow has a few more fields so lets break down what is defined in the following line:
The top line is the INGEST section which defines the ruleset for the data we are about to ingest. As you notice this need to be encapsulated in square brackets, but lets break down the key syntax and usage:
- INGEST – This syntax specifies that we are defining the ruleset
- vendor – The vendor that the parsing rules apply to
- product – The product that the parsing rules apply to
- target_dataset – this will define the dataset name that will be used to search in XQL
- no-hit – In this example we have “drop” which does not keep the data in the event that the parsing rules do not apply. The other option is “keep”, which would store the data in the _raw_log field since it cannot be parsed.
The semicolon is used at the end of an ingest section. When it is complete hit save in the bottom right of the UI. At this point any new data received that matches the parser will be parsed and stored in the newly designated fields.
5.XQL Searches, Widgets, and Dashboard(s)
Now we have completed the process of running an action script, getting data into the system and parsing that data is easily identifiable fields. Next we want to make use out of this data. In some cases you will want to search the data with XQL in the Query Builder. You could even create correlation rules from these XQL searches as well if you wanted to get alerts. In this example though, we will use a series of XQL searches to create widgets and ultimately a dashboard.
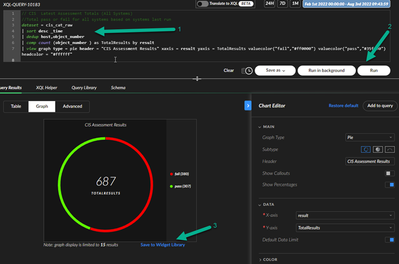
Here are the different XQL searches we will use to create the widgets:
// CIS Latest Assessment Totals (All Systems)
//Total pass or fail for all systems based on systems last run
dataset = cis_cat_raw
| sort desc _time
| dedup host,object_number
| comp count (object_number ) as TotalResults by result
| view graph type = pie header = "CIS Assessment Results" xaxis = result yaxis = TotalResults valuecolor("fail","#ff0000") valuecolor("pass","#35ff00") headcolor = "#ffffff"
2.
// CIS Failure By Host
// Table showing individual failures by host and object number
dataset = cis_cat_raw
| sort desc _time
| dedup host,object_number
| filter result = "fail"
| sort asc object_number
| fields host, object_number , ensure , result
| sort asc object_number
3.
//CIS Top 10 Failed Benchmark Tests
//Report which benchmark test is failing the most across all systems
dataset = cis_cat_raw
| sort desc _time
| dedup host,object_number
| filter result = "fail"
| comp count (result ) as TotalPerObject by object_number , ensure
| sort desc TotalPerObject
| limit 10
4.
//CIS Top 10 Failed Benchmark Tests
//Report which benchmark test is failing the most across all systems
dataset = cis_cat_raw
| sort desc _time
| dedup host,object_number
| filter result = "fail"
| comp count (result ) as TotalPerObject by object_number , ensure
| sort desc TotalPerObject
| limit 10
5.
//CIS Total Fail By Host
//Total number of failure for each object tested
dataset = cis_cat_raw
| filter result = "fail"
| sort desc _time
| dedup host,object_number
| comp count (result) as TotalFails by host
| sort desc TotalFails
| view graph type = column subtype = grouped layout = horizontal header = "Total Fails By Host" xaxis = host yaxis = TotalFails seriescolor("TotalFails","#e41a1a")
6.
//CIS Total Pass By Host
//Sum of entire number of passed tests by host
dataset = cis_cat_raw
| sort desc _time
| dedup host,object_number
| filter result = "pass"
| comp count (result) as TotalPass by host
| view graph type = column subtype = grouped layout = horizontal header = "Total Pass By Host" xaxis = host yaxis = TotalPass seriescolor("TotalPass","#5eed0b")
Create Each Widgets Based On Above XQL Searches
0. Navigate to: Incident Response -> Query Builder -> XQL Search
- Use one of the searches listed and paste it into the query box
- Click Run in the bottom right of the query box
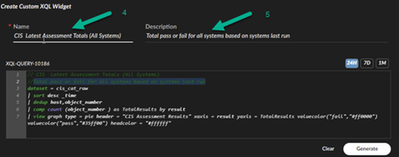
- Click Save Widget
4. Enter the Name – The first comment line in the XQL search can be used for Name
5. Enter then Description - The second comment line in the XQL search can be use for description
6. Click ‘Save widget’ in the bottom right
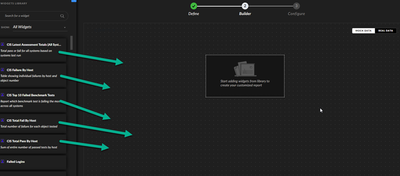
Create A Dashboard and Add The Widgets That Were Just Created
- Navigate to: Dashboards & Reports -> Dashboard Manager
- Click New Dashboard in top right of the windows
- Give your dashboard a Name and optional description and click Next
- Drag and drop each of your CIS widgets you created. You can arranged the layout to your desire
- Click Next
- Select the options for whether this should be a Public or Private dashboard, or if this is a default dashboard
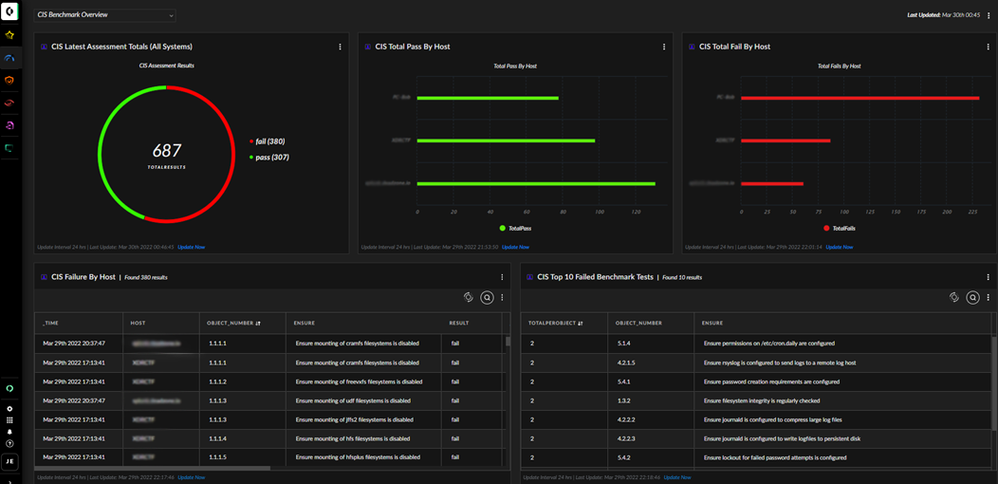
Once completed you can navigate to: Dashboard & Reports ->Dashboard and then select the name of the dashboard you created from the drop down.
Script
###########################################
# CIS CAT Pro For Cortex XDR #
# #
# Requires existing cis-cat binaries #
# and benchmark files on OS #
###########################################
import os
import sys
import requests
import subprocess
from time import time
#global parameters for XDR HTTP collector
#if desired apiurl,apikey can be added as run variables and passed in from the UI
apiurl = “”
apikey = “”
def run(benchmark):
#setup for operating sytem, configure to your install location
if sys.platform == "linux" or sys.platform == "linux2":
cisrootdir = "/opt/cis/Assessor-CLI/"
cisbinpath = "/opt/cis/Assessor-CLI/Assessor-CLI.sh"
cisresults = "/opt/cis/Assessor-CLI/reports/cisresults.csv"
cisbenchmarkpath = cisrootdir + "benchmarks/" + benchmark
elif sys.platform == "win32":
cisrootdir = "C:\\Assessor-CLI\\"
cisbinpath = "C:\\Assessor-CLI\\Assessor-CLI.bat"
cisresults = "C:\\Assessor-CLI\\reports\\cisresults.csv"
cisbenchmarkpath = cisrootdir + "benchmarks\\" + benchmark
# elif sys.platform == "darwin":
# cisresults = "C:\\Assessor-CLI\\reports\\cisresults.csv"
cisoptions = "-cl 2 -nts -rp cisresults -csv "
#validate cis cat binary exists
if not os.path.isabs(cisbinpath):
sys.stderr.write("CIS-Cat binary file missing")
return 0
#validate cis cat benchmark file exists
if not os.path.isabs(cisbenchmarkpath):
sys.stderr.write("CIS-Cat benchmark file missing")
return 0
#set binary path and execute
command = cisbinpath + " -b " + cisbenchmarkpath + " " + cisoptions
os.system(command)
#validate results file and read in results
if not os.path.isabs(cisresults):
sys.stderr.write("CIS-Cat results file missing")
return 0
with open(cisresults,"rb") as f:
contents = f.read().decode("UTF-8")
#post response to XDR server
headers = {
"Authorization": apikey,
"Content-Type": "text/plain"
}
body = "{" + contents + "}"
res = requests.post(url=apiurl, headers=headers, data=body.encode("UTF-8"))
if (res.status_code != 200):
sys.stderr.write("Error:" + res.reason)
return 0
return 1
- Labels:
-
Strata Logging Service
- Mark as New
- Subscribe to RSS Feed
- Permalink
07-25-2023 09:51 PM
Great article, thanks.
One question, do you know how do we add a description to the data fields created in the parser that is then shown in the dataset schema?
- Mark as New
- Subscribe to RSS Feed
- Permalink
07-26-2023 03:44 PM
Currently the descriptions you see in the schema come from engineering adding them to the product. There's no information at this time if it will be included as an item that can be passed into the parser..
- Mark as New
- Subscribe to RSS Feed
- Permalink
07-26-2023 06:01 PM
Thanks for the quick reply, thought that was probably the case.
- 8062 Views
- 4 replies
- 5 Likes
Show your appreciation!
Click Accept as Solution to acknowledge that the answer to your question has been provided.
The button appears next to the replies on topics you’ve started. The member who gave the solution and all future visitors to this topic will appreciate it!
These simple actions take just seconds of your time, but go a long way in showing appreciation for community members and the LIVEcommunity as a whole!
The LIVEcommunity thanks you for your participation!


