- Access exclusive content
- Connect with peers
- Share your expertise
- Find support resources
Click Preferences to customize your cookie settings.
Unlock your full community experience!
The Cortex XDR not installed still incident getting generated
- LIVEcommunity
- Discussions
- Security Operations
- Cortex XDR Discussions
- The Cortex XDR not installed still incident getting generated
- Subscribe to RSS Feed
- Mark Topic as New
- Mark Topic as Read
- Float this Topic for Current User
- Printer Friendly Page
The Cortex XDR not installed still incident getting generated
- Mark as New
- Subscribe to RSS Feed
- Permalink
11-24-2023 06:54 AM
We have observed incident on the server in which Cortex XDR is not installed. The system is only present in the asset inventory. How is this possible, on what basis incident is getting generated?
Incident Name: Multiple Rare LOLBIN Process Executions by User
Thanks in advance.
- Mark as New
- Subscribe to RSS Feed
- Permalink
11-27-2023 01:39 PM - edited 11-27-2023 01:40 PM
Hello Shinde_Dipak,
'Multiple Rare LOLBIN Process Executions by User' alert is generated by XDR Analytics were detected. Reference Multiple Rare LOLBIN Process Executions by User • Cortex XDR Analytics Alert Reference
The source for this detection is data collected from the XDR Agent with Identity Analytics enabled. However, customers can take advantage of analytics network or identity detectors on a host in the absence of the XDR agent if additional network and identity data sources (Cloud Identity Engine, Azure etc.) are onboarded directly into Cortex XDR.
For example, in addition to the agent, Cortex XDR can ingest PAN NGFW Enhanced application logs (EAL) and Third-party authentication service logs with the Pro GB or Cloud license to detect threats by collecting and analyzing cloud logs. Its analytics detectors examine cloud audit, flow, and identity logs to baseline behavior.
Reference
Analytics • Cortex XDR Pro Administrator Guide • Reader • Palo Alto Networks documentation portal
To investigate, concerning the endpoint data collection gathered to stitch an alert, review the Debug alert data collected from the event for analysis:
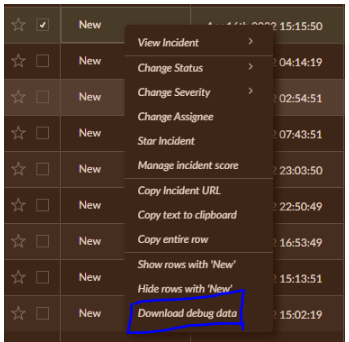
Collect Debug data from Incidents Tab
- Go To Incidents Tab and select the Incident that you want to Debug.
- Alt+ Right Click on the Incident and select Download Debug Data
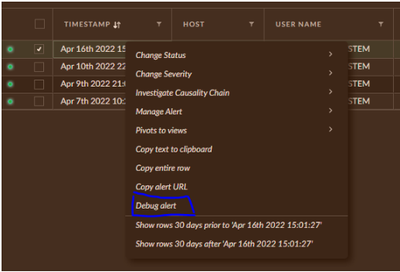
Collect Debug Alert data From Alerts page
- Go to the Alert and press Alt+ Right Click to select Debug Alert
- It will open another window with Debug logs. Click on 'Copy Log' and view the logs for analysis.
If you found this answer helpful, please select Accept as Solution.
Thank you!
- 1045 Views
- 1 replies
- 0 Likes
Show your appreciation!
Click Accept as Solution to acknowledge that the answer to your question has been provided.
The button appears next to the replies on topics you’ve started. The member who gave the solution and all future visitors to this topic will appreciate it!
These simple actions take just seconds of your time, but go a long way in showing appreciation for community members and the LIVEcommunity as a whole!
The LIVEcommunity thanks you for your participation!
- is there a way to block Ethernet to USB type C in cortex ? in Cortex XDR Discussions
- Configuring alerts in Cortex XDR to prevent incident generation in Cortex XDR Discussions
- JSON Sample Incident Generator in Cortex XSOAR Discussions
- Is it safe to rename Agent Installations in Cortex and retain Connection? in Cortex XDR Discussions
- BIOC Rules for OneDrive File Uploads | Exfiltration in Cortex XDR Discussions


