Empowering Garuda: Unveiling a Unified API Layer with Cardinality Insights for Comprehensive Observability

cancel
Showing results for 
Show  only  | Search instead for 
Did you mean: 
Announcements
Please sign in to see details of an important advisory in our Customer Advisories area.
L2 Linker

Title_Empowering-Garuda_palo-alto-networks.jpg

This blog was written by Puneet Gupta.


As the pursuit of achieving unparalleled observability for our systems at Palo Alto Networks continues, I’m excited to share the intricate details of a game-changing development — the creation of a unified API layer for Garuda. If you haven’t already, I invite you to explore the foundation of our observability journey by checking out the first part of this series, where we introduced the Garuda platform and the revolutionary Garuda Operator.


Fig 1_Empowering-Garuda_palo-alto-networks.png


Now, in this latest instalment, we dive deeper into the architecture, features, and transformative impact of a comprehensive API layer that encompasses logs, metrics, rules, and everything Garuda needs. Notably, we’ve incorporated cardinality insights APIs, enriching our observability capabilities. But that’s not all — join me in discovering how we’ve extended our innovation to the front end, creating a powerful visualization interface to harness the full potential of Garuda’s insights.


Why Unified API Layer?


As we embarked on the journey of constructing the Garuda observability platform, we faced challenges that demanded a cohesive and innovative solution. The Unified API Layer emerged as the key element to address critical aspects, ensuring Garuda’s observability capabilities could evolve seamlessly. Now, let’s delve into the reasons why we created this platform and how it’s set to change the way we perceive things.


  1. Cardinality Insights for Scalability: As our platform scaled, the looming cardinality problem posed challenges with both costs and query performance when ingesting logs and metrics in the billions. In response, the Unified API Layer emerged as a strategic solution, providing cardinality insights into APIs. This enables precise identification of the root causes of cardinality issues, optimizing costs, and ensuring peak query performance.
  2. Optimizing Recording Rules for Efficiency: The challenge of optimizing recording rules without compromising query performance. The Unified API Layer not only allows us to observe but actively enhances recording rules. With this tool, we systematically analyze rules and offer actionable suggestions to tenants, ensuring the platform operates at its highest efficiency.
  3. Health Check and Platform Version Details: A robust observability platform requires continuous health monitoring and a standardized approach to fetch platform details. The Unified API Layer streamlines health checks across diverse platforms, providing a means to retrieve vital details. This capability is invaluable for testing, remediation, and maintaining the overall robustness of our observability infrastructure.
  4. Seamless Dashboard Migrations: With Grafana’s evolution, the Unified API Layer serves as the key orchestrator for transitioning from old to new dashboards. Whether through an intuitive UI or a potent CLI tool, this layer significantly simplifies dashboard migrations for users. Notably, this feature is absent in the Garuda API, prompting us to migrate our existing tool to fill this gap.
  5. Security and Controlled Access: The Unified API Layer, conceived with security at its core, introduced an audited and API key-based access approach. This not only improved security protocols but also allowed for a more controlled and monitored interaction with backend tools such as Mimir, Loki, and others.
  6. Unifying Open Source Tools: API hides the complexity of collaboration between tools like MimirTool, LogCLI, Mimir & Loki, Grafana API, and others, resulting in a unified solution. Users can now adopt a single, user-friendly solution without navigating the complexities of individual tools, effortlessly accessing diverse functionalities.


In summary, the Unified API Layer plays a pivotal role in the Garuda observability platform. By addressing cardinality, optimizing rules, ensuring health, simplifying migrations, and enhancing security, it helps enable a robust, scalable, and secure user experience. Now, let’s explore the Garuda API architecture for insights.


Architecture of Garuda API :
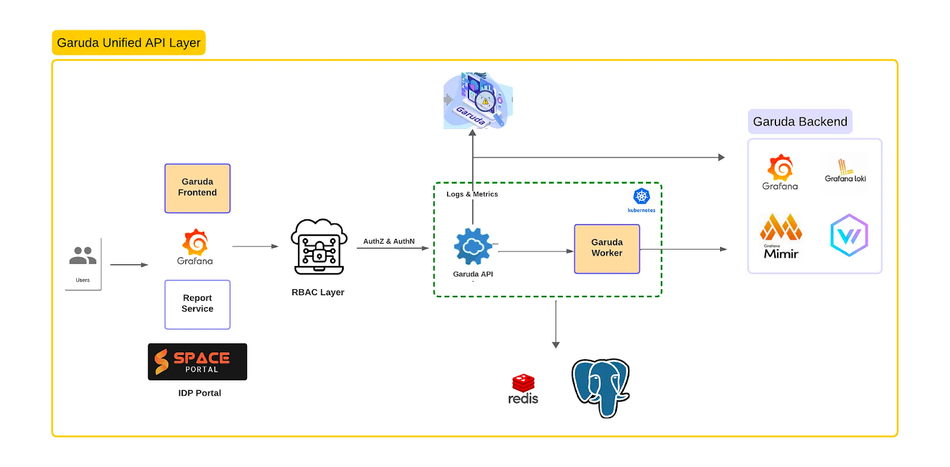
 

High-Level ArchitectureHigh-Level Architecture


Let’s look into Garuda API architecture

  1. REST API Layer and Data Fetching:
  • Garuda API: REST API layer, Garuda API serves as the user-facing gateway. It skillfully handles diverse data types and orchestrates their combination to craft server responses for users.
  • Garuda Worker: On the backend, the Garuda Worker, operating as a cron job, diligently fetches voluminous data from the Garuda backend at regular intervals. This proactive approach avoids runtime delays and lays the groundwork for preprocessing.

Fig 3_Empowering-Garuda_palo-alto-networks.png


  1. Data Processing and Enrichment:
  • Preprocessing Magic: With fetched data in hand, Garuda Worker initiates preprocessing, preparing the raw information for insightful analysis.
  • Insightful Enrichment: Different data sources contribute to the enrichment process, weaving a tapestry of insights that will eventually be presented to users. This meticulous process ensures the delivery of comprehensive and meaningful information.
  1. Scalability with Kubernetes and Helm:
  • Containerized Deployment: The entire Garuda solution is deployed with Kubernetes, leveraging the scalability and manageability it offers. Helm charts streamline deployment processes, ensuring consistency and efficiency across the platform.
  1. RBAC Layer for Security:
  • AuthN and AuthZ Excellence: Security is paramount, and the Garuda API incorporates a custom-built RBAC layer. Istio integration, along with JWT and service tokens, ensures robust authentication and authorization, setting the stage for a secure user experience.
  1. Integration with Frontend and Grafana:
  • Frontend Harmony: Garuda API seamlessly integrates with various frontends, including the widely used Grafana using grafana plugin. This integration ensures users can interact effortlessly with the enriched insights, presented in a visually appealing manner.


Let’s look into Garuda API in action 

Cardinality Insights: 

in the context of our platform, signifies the count of unique combinations of label values or series. A cardinality explosion occurs when this count becomes excessively high, potentially causing platform disruptions due to increased processing times and query complexities. Retrieving and processing all cardinality during queries can be time-consuming. Therefore, a robust platform must proactively manage high cardinality metrics to ensure efficient performance and prevent potential breakdowns.
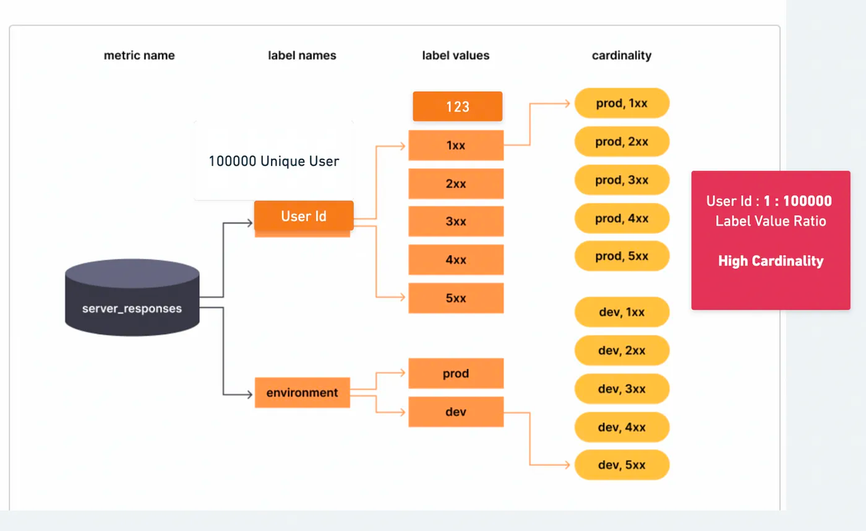
High CardinalityHigh Cardinality


Fig 5_Empowering-Garuda_palo-alto-networks.png


  • Label Value Cardinality

Our API offers two essential functionalities: one reveals the cardinality of every metric, while the other provides insights into the cardinality of labels and label values, aiding in the identification and management of high cardinality metrics within our platform.

Fig 6_Empowering-Garuda_palo-alto-networks.png


  • Used vs Unused Metrics : 

Our system meticulously discerns tenant-specific metric usage by extracting data from user Grafana dashboards, alert and recording rules, and queries. Used metrics are those actively employed by tenants, contributing to their monitoring and analytics needs. On the contrary, unused metrics are those that remain dormant or unutilized. This metric categorization facilitates a detailed analysis, allowing users to prioritize and manage the cardinality of both actively utilized (used) and inactive (unused) metrics effectively for optimized resource allocation.


Fig 7_Empowering-Garuda_palo-alto-networks.png


Fig 8_Empowering-Garuda_palo-alto-networks.png


  • Label Used vs Unused : 

Our API efficiently identifies labels with zero used metrics and provides cardinality insights, detailing the extent of metric consumption for each of these inactive labels. This empowers users to streamline resource allocation by addressing and optimizing unused metric labels.

Fig 9_Empowering-Garuda_palo-alto-networks.png


  • Duplicates metrics

Our system detects instances where a metric is ingested more than once, often occurring when the same metric is sent from different exporters running on the customer’s end. This ensures accurate monitoring and avoids redundancy in metric ingestion.

Fig 10_Empowering-Garuda_palo-alto-networks.png

  • Log Volume:

Our API provides insights into the total log volume sent by the customer to the platform, breaking it down further to reveal the contribution of each service, such as clusters, namespaces, and apps. This granular analysis enables customers to pinpoint noisy services, facilitating informed actions for efficient log management and resource optimization.


Now let’s see how we are using these insights for our customer

Report Service and Auto-Remediation:


  • Customer Insights via Reports: A dedicated report service utilizes Garuda API to extract periodic insights, sending them to customers via email. This proactive approach keeps users informed about their infrastructure’s performance.
  • Auto-Remediation Magic: Garuda API contributes to auto-remediation jobs, identifying and addressing issues such as abrupt cardinality or sudden log increases. This ensures platform stability and optimal performance, preventing potential bottlenecks and checking if any unused metric is being ingested in the platform drop all unused metrics if they want later to unblock they can do that also.
  • we are giving frontend or Grafana-based panel or direct API access so customers can come can explore their platform insights and make decisions to improve & decrease the cost of their platform


Impact of cardinality insights apis: 


The impact of our Cardinality Insights APIs has been significant; one customer, leveraging these APIs, efficiently dropped top unused metrics, reducing active series by nearly 80% and realizing substantial cost savings. This practice is consistently applied across all customers, leading to frequent drops of unused metrics, resulting in significant cost reductions and enhanced platform performance.


Fig 11_Empowering-Garuda_palo-alto-networks.png


  • Recording rule analysis: 

By analyzing recording intervals, our system records and displays the internal recording interval for users. This information aids users in understanding the number of recording rules operating at specific intervals. Increasing the interval, especially for 1-second recording rules, can significantly enhance overall system performance, optimizing resource utilization and responsiveness.


Fig 12_Empowering-Garuda_palo-alto-networks.png


  • Customer Info: 

The current version of Garuda is [insert version number]. Garuda’s open-source components, including Grafana, Mimir, and Loki, are running on their respective versions, with comprehensive health check information readily available for users.

In conclusion, Garuda stands as a robust observability platform, seamlessly integrating powerful features like Cardinality Insights APIs to optimize resource usage and enhance performance. With proactive identification of unused metrics, customers experience significant cost savings and improved efficiency. The platform’s versioned components and comprehensive health checks ensure a stable and cutting-edge environment, making Garuda a reliable ally in the dynamic landscape of observability.


Wrapping UP! 


Achieving a seamless and unified API layer for Garuda was no small feat, but now, with this comprehensive solution in place, consistent and reliable monitoring has become a reality. The Unified API Layer, intricately designed, empowers users to navigate through diverse metrics effortlessly. If you’ve encountered similar challenges or have insights to share, feel free to drop your thoughts in the comments section or connect with us on LinkedIn.


From the Observability Platform Team at Palo Alto Networks:


Thanks for reading!

1 Comment
Community Team Member

great blog! love seeing what the engineering blog series has to offer!