- Access exclusive content
- Connect with peers
- Share your expertise
- Find support resources
Click Preferences to customize your cookie settings.
Unlock your full community experience!
Panorama - Logging and Reporting Settings
- LIVEcommunity
- Discussions
- General Topics
- Panorama - Logging and Reporting Settings
- Subscribe to RSS Feed
- Mark Topic as New
- Mark Topic as Read
- Float this Topic for Current User
- Printer Friendly Page
Panorama - Logging and Reporting Settings
- Mark as New
- Subscribe to RSS Feed
- Permalink
02-15-2017 02:28 PM
I'm rather confused by the quota settings. I've had my Panorama for about 3 years and was asked to produce a report today and with 500GB of storage I relealized that my history was only about 5 days to produce a user activity report. I would have sworn that wasn't always the case, so I'm not sure what happened. I've been adjusting the quotas, and can't really find a good document to explain the various groups, but I really want to have my quota optimized so I can storage as much user activity as possible. It also seems that either I'm adjust something the wrong way or each time you adjust it wipes out your data because right now I only have 1 hour of history???? These are my current settings I pulled from command line. Can anyone offer any input recommendations.
Thanks!
system: 1.00%, 4.856 GB Expiration-period: 0 days
config: 1.00%, 4.856 GB Expiration-period: 0 days
appstat: 1.00%, 4.856 GB Expiration-period: 0 days
traffic: 20.00%, 97.130 GB Expiration-period: 0 days
threat: 2.00%, 9.713 GB Expiration-period: 0 days
trsum: 2.00%, 9.713 GB Expiration-period: 0 days
hourlytrsum: 1.00%, 4.856 GB Expiration-period: 0 days
dailytrsum: 1.00%, 4.856 GB Expiration-period: 0 days
weeklytrsum: 1.00%, 4.856 GB Expiration-period: 0 days
urlsum: 55.00%, 267.107 GB Expiration-period: 0 days
hourlyurlsum: 1.00%, 4.856 GB Expiration-period: 0 days
dailyurlsum: 1.00%, 4.856 GB Expiration-period: 0 days
weeklyurlsum: 1.00%, 4.856 GB Expiration-period: 0 days
thsum: 2.00%, 9.713 GB Expiration-period: 0 days
hourlythsum: 1.00%, 4.856 GB Expiration-period: 0 days
dailythsum: 1.00%, 4.856 GB Expiration-period: 0 days
weeklythsum: 1.00%, 4.856 GB Expiration-period: 0 days
extpcap: 1.00%, 4.856 GB Expiration-period: 0 days
hipmatch: 1.00%, 4.856 GB Expiration-period: 0 days
- Mark as New
- Subscribe to RSS Feed
- Permalink
02-15-2017 07:37 PM - edited 02-15-2017 07:42 PM
URL filtering logs are included in the threat database, so you might want to increase the threat quota considerably. Maybe you thought those went in the URL summary database?
I had a weird bug once when I allocated exactly 100% of the quota. I ended up with a negative unallocated value and I think I lost some logs because of that. You seem to have 5% unallocated space, so this is probably not related to your problem.
Benjamin
- Mark as New
- Subscribe to RSS Feed
- Permalink
02-16-2017 05:23 AM
That is exacly what I thought that the URL filtering logs were in the URL summary. You would assume, right?
Thank you for the reply!
- Mark as New
- Subscribe to RSS Feed
- Permalink
02-16-2017 05:29 AM - edited 02-16-2017 05:31 AM
keep in mind the logdb is a database, so changing quotas requires the db to be rewritten thus purging the data inside
you will want to increase the traffic (+-30) and threat (+-15) quota considerably as these would be your 'workhorse' logs, and decrease urlsum dramatically (2-5?) as this is a summary db which takes up less space per log entry
you'll also want to up the trsum (5-10) and hourlytrsum (3) as this is where user activity reports come from
anything that has *sum in it is a summary database containing 'statistical' data versus cold hard log entries
PANgurus - Strata & Prisma Access specialist
- Mark as New
- Subscribe to RSS Feed
- Permalink
02-16-2017 05:34 AM
Thanks again for the info. I had a case open, but got better support here.
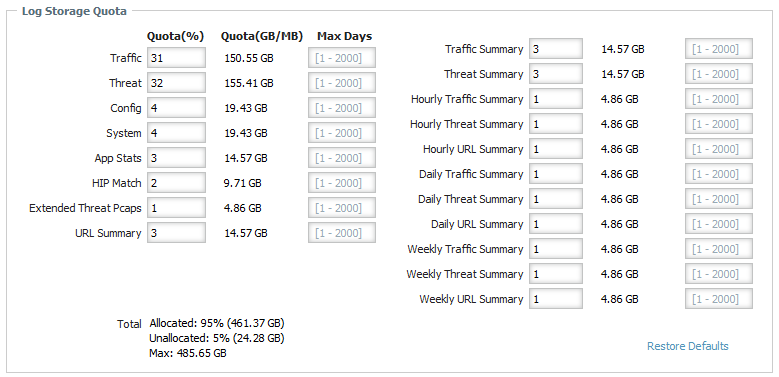
I reset to default and made some minor adjustments. This is what I have now.
- 4750 Views
- 4 replies
- 0 Likes
Show your appreciation!
Click Accept as Solution to acknowledge that the answer to your question has been provided.
The button appears next to the replies on topics you’ve started. The member who gave the solution and all future visitors to this topic will appreciate it!
These simple actions take just seconds of your time, but go a long way in showing appreciation for community members and the LIVEcommunity as a whole!
The LIVEcommunity thanks you for your participation!
- IoT Devices in Panorama in Panorama Discussions
- Panorama PDF summary report of 1 week/month in Panorama Discussions
- Panoarama M-300 Log Storage in Panorama Discussions
- Panorama reports not available since the upgrade in Panorama Discussions
- Tuning Panorama HA Timers to Stop False HA1 Alerts over MPLS in Panorama Discussions


