- Access exclusive content
- Connect with peers
- Share your expertise
- Find support resources
Click Preferences to customize your cookie settings.
Unlock your full community experience!
How to find source of high open sessions and/or throughput
- LIVEcommunity
- Discussions
- General Topics
- Re: How to find source of high open sessions and/or throughput
- Subscribe to RSS Feed
- Mark Topic as New
- Mark Topic as Read
- Float this Topic for Current User
- Printer Friendly Page
How to find source of high open sessions and/or throughput
- Mark as New
- Subscribe to RSS Feed
- Permalink
10-30-2015 07:04 AM
If your Palo Alto firewall is experiencing an unusually high OPEN session count, and/or high throughput, what is the best way to determine the source or destination at the same time of the event?
We have most of our security rules set to log at session end, so doing research on open sessions makes it a little harder. I have confirmed that the ACC tab does not show data for open sessions either. The Session Browser isn't too helpful because 1) you can't search by Start Time, 2) it only shows up to 2048 open sessions, 3) you can't export the results, 4) it's hard to pinpoint a specific source or destination IP.
- Mark as New
- Subscribe to RSS Feed
- Permalink
11-01-2015 12:56 PM
So all new sessions last long and don't expire to get log into traffic log?
You should enable syn cookies on zone protection profile. Then you have log when treshold is reached.
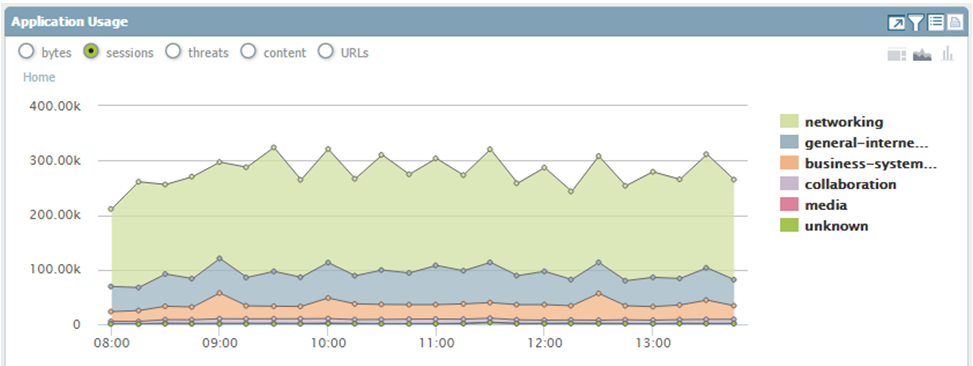
Monitor > App scope > Change monitor should show latest changes.
You can create custom report to show packet count and if you order by quarter hour to see if any anomalies.
Pan(w)achrome Chrome plugin shows really high overview in real time (source/destination physical/logical interface with packet/throughput count).
Palo Alto Networks certified from 2011
- Mark as New
- Subscribe to RSS Feed
- Permalink
11-03-2015 04:39 AM
I feel your pain, live with logging at session end the session table is your only options.
At times when we have had recurring issues like this we add log at session start to the most likely rule candidates based on the post event logging that we do have. These are then much easier to filter when it comes around the next time.
ACE PanOS 6; ACE PanOS 7; ASE 3.0; PSE 7.0 Foundations & Associate in Platform; Cyber Security; Data Center
- Mark as New
- Subscribe to RSS Feed
- Permalink
04-10-2017 12:07 PM
I need to resurrect this issue back from the dead. We monitor our PA's with SNMP, and when the Session Count and/or Connection Rate increases to a number above normal, it's always a struggle to find the source of the problem using the PA interface. Anyone have any tips?
Here's an example:
Our SNMP monitoring tool clearly shows a spike/hump in Open (TCP) Sessions...
The ACC tab does not reveal that there were any indications of a spike in traffic.
- Mark as New
- Subscribe to RSS Feed
- Permalink
05-16-2017 05:23 AM
We have the same issue with PA-5050 v7.1.7. Monitoring through SNMP shows incorrect session values that do not match the ones shown by the firewall on CLI. It seems a bug with the panSessionActive OID.
- Mark as New
- Subscribe to RSS Feed
- Permalink
05-18-2017 03:59 AM
I am thinking to setup a netflow collector. I am hoping Netflow may provide a closer to "real time" usage. Any comments or suggestion on netflow ?
E
- 9551 Views
- 5 replies
- 0 Likes
Show your appreciation!
Click Accept as Solution to acknowledge that the answer to your question has been provided.
The button appears next to the replies on topics you’ve started. The member who gave the solution and all future visitors to this topic will appreciate it!
These simple actions take just seconds of your time, but go a long way in showing appreciation for community members and the LIVEcommunity as a whole!
The LIVEcommunity thanks you for your participation!
- Handling voip behind ION 1200S in Prisma SD-WAN Discussions
- PA1420 IKE packet disappear between receive (ingress) and firewall session state in General Topics
- DHCP Relay over SDWAN issue in Advanced SD-WAN for NGFW Discussions
- Data Plane CPU utilization Reaches more than 90 % in VM-Series in the Public Cloud
- High Data Plane Utilization During Business Hours in Next-Generation Firewall Discussions


