- Access exclusive content
- Connect with peers
- Share your expertise
- Find support resources
Click Preferences to customize your cookie settings.
Unlock your full community experience!
AWS VM-100 (2 VCPU limit) on M4/M5.xlarge (4 VCPU onboard) - wasted VCPU?
- LIVEcommunity
- Discussions
- Network Security
- VM-Series in the Public Cloud
- Re: AWS VM-100 (2 VCPU limit) on M4/M5.xlarge (4 VCPU onboard) - wasted VCP
- Subscribe to RSS Feed
- Mark Topic as New
- Mark Topic as Read
- Float this Topic for Current User
- Printer Friendly Page
AWS VM-100 (2 VCPU limit) on M4/M5.xlarge (4 VCPU onboard) - wasted VCPU?
- Mark as New
- Subscribe to RSS Feed
- Permalink
09-11-2020 05:27 AM - edited 11-23-2020 01:04 PM
Hello Experts,
Please help to understand what happens when one runs AWS VM-100 (2 VCPU limit) on M4.xlarge or M5.xlarge (4 VCPU onboard).
It works fine. But it seems like two of four VCPUs are staying idle in such setup. Would you agree?
I tried to use CloudWatch to see core specific CPU utilization, it is only display overall stats and does not show per VCPU stats
Please see some bits from my research below.
Regards,
Sergg
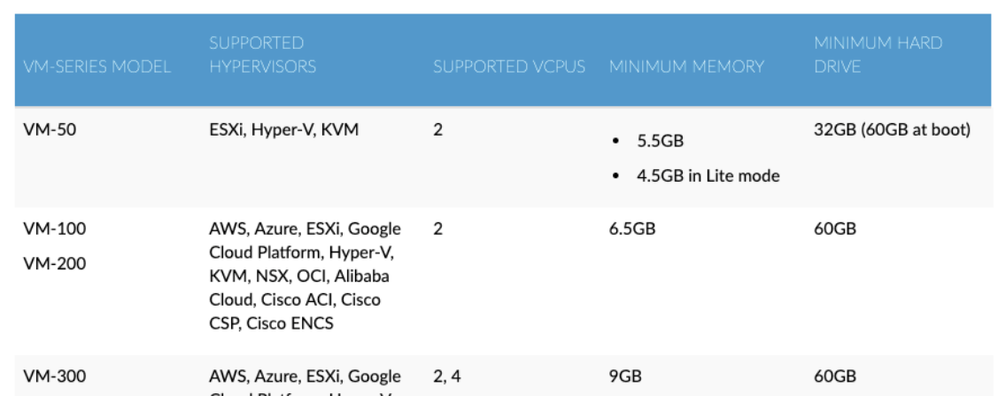
Details about VM-100 virtual hardware support
VM-Series on Amazon Web Services Performance and Capacity
Details about amount of the resources supported by VM license type from VM-Series for AWS Sizing
Please note – VM-100 does only support 2 VCPU
Details about AWS EC2 types
Details about EC2 instances from https://aws.amazon.com/ec2/instance-types/
Please note xlarge instances provide 4 VCPU (while VM-100 can only consume 2 VCPU)
M4 options:
M5 options:
Details about declared VM throughput
From VM-Series on Amazon Web Services Performance and Capacity
- Mark as New
- Subscribe to RSS Feed
- Permalink
09-11-2020 05:36 AM
You may see a nominal performance increase by running the bigger instance size due some of the underlying AWS hashing to hardware. The increase will be no where close to the performance of running a VM-300 on the same instance types.
- Mark as New
- Subscribe to RSS Feed
- Permalink
09-11-2020 05:55 AM
Update: I discovered that SNMP monitoring does indeed only report 2 CPU and does individual graphs got each.
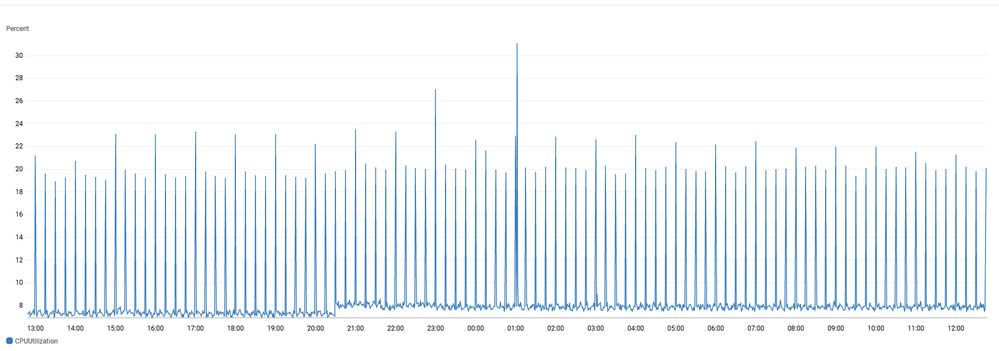
Now I'm suspecting AWS CloudWatch graphs does not represent true AWS VA firewall load. This is because AWS combines the load of 4 VCPUs (2 busy and 2 totally idle) and therefore in this situation, AWS CloadWatch results need to be multiplied by two (to compensate for CPUs provided by AWS but not used by firewall software)
My sample data for a firewall I'm examining (24 hours - but it can not be compared because in a massive difference in polling frequency and methods)
AWS CloudWatch:
SNMP monitoring:
- Mark as New
- Subscribe to RSS Feed
- Permalink
09-11-2020 06:07 AM
Similar to physical firewalls there is the management and data plane separation. And there is (at least one) dedicated CPU assigned to the management. I'm getting there but still confused. In one hand there is a document (see below) telling unlicensed CPUs allocated to management. In the other hand, my SNMP monitoring only reports two CPUs back.
Does my VM-100 in AWS effectively only has 1 VCPU for traffic?
From VM-Series System Requirements
The number of vCPUs assigned to the management plane and those assigned to the dataplane differs depending on the total number of vCPUs assigned to the VM-Series firewall. If you assign more vCPUs than those officially supported by the license, any additional vCPUs are assigned to the management plane.
| Total vCPUs | Management Plane vCPUs | Dataplane vCPUs |
2 | 1 | 1 |
4 | 2 | 2 |
8 | 2 | 6 |
16 | 4 | 12 |
- Mark as New
- Subscribe to RSS Feed
- Permalink
09-11-2020 02:13 PM
@jmeurerwith regards to your statement
You may see a nominal performance increase by running the bigger instance size due some of the underlying AWS hashing to hardware. The increase will be no where close to the performance of running a VM-300 on the same instance types.Thank you for sharing the first-hand experience with running VM-100 and VM-300 on the same instance type. Perhaps the difference is due to the number of VCPUs used by bata plane.
- Mark as New
- Subscribe to RSS Feed
- Permalink
11-23-2020 01:10 PM
You are correct, the VM-100 will only utilize 2 vCPU for data plane.
- Mark as New
- Subscribe to RSS Feed
- Permalink
11-23-2020 01:42 PM
I tested this inside out. Here is final take:
- VM-100 is limited to 2 VCPU all together
- Out of 2 VCPU at least one is dedicated to management
- One 1 VCPU is left for DP (data plane)
- On the AWS M4 type machine with 4 VCPUs only half is used.
- Mark as New
- Subscribe to RSS Feed
- Permalink
11-29-2020 09:28 PM
What OIDs are you using in SNMP monitoring?
If you are monitoring hrProcessorLoad, you will only see two objects, no matter what model of Palo Alto FW you are using.
It corresponds to the utilization of the data plane and the management plane.
Also, these values correspond to the values of the system resource wedge in the dashboard.
You can find it at https://knowledgebase.paloaltonetworks.com/KCSArticleDetail?id=kA10g000000ClaSCAS
If you want to see the utilization per VCPU, you need a little trick.
Please press "1" after running "show system resources follow" to toggle view to show separate states.
https://knowledgebase.paloaltonetworks.com/KCSArticleDetail?id=kA10g000000PLZZCA4
I do not know the REST API that corresponds to this idea. Naturally, I don't know the corresponding SNMP objects either.
Therefore, I don't believe there is an elegant means of continuous monitoring.
In the VM-Series and PA-850, for example, the management plane and the data plane are not physically separated, and the data plane is run as a process called pan_task.
The number of pan_task processes increases or decreases according to the capacity of the Palo Alto FW and is allocated to logical cores from CPU1 onwards using CPU affinity (a feature of the Linux kernel).
I remember that the CPU utilization of the pan_task process, which can be checked with the above command, behaved a little differently depending on whether SR-IOV was enabled or not.
- 11722 Views
- 7 replies
- 1 Likes
Show your appreciation!
Click Accept as Solution to acknowledge that the answer to your question has been provided.
The button appears next to the replies on topics you’ve started. The member who gave the solution and all future visitors to this topic will appreciate it!
These simple actions take just seconds of your time, but go a long way in showing appreciation for community members and the LIVEcommunity as a whole!
The LIVEcommunity thanks you for your participation!
- Onboard production firewall to STRATA CLOUD MANAGER in Strata Cloud Manager
- Onboarding PA-550 to 12.1.4 in Panorama Discussions
- Issue after onboard Azure VM into SCM in Strata Cloud Manager
- Regarding the Operational Specifications for HA Mode in Next-Generation Firewall Discussions
- Panorama Onboarding and Managing of PAN FW's in Panorama Discussions


