- Access exclusive content
- Connect with peers
- Share your expertise
- Find support resources
Click Preferences to customize your cookie settings.
Unlock your full community experience!
Help finding green alert log screen in Cortex XDR
- LIVEcommunity
- Discussions
- Security Operations
- Cortex XDR Discussions
- Re: Help finding green alert log screen in Cortex XDR
- Subscribe to RSS Feed
- Mark Topic as New
- Mark Topic as Read
- Float this Topic for Current User
- Printer Friendly Page
- Mark as New
- Subscribe to RSS Feed
- Permalink
09-21-2023 01:58 PM
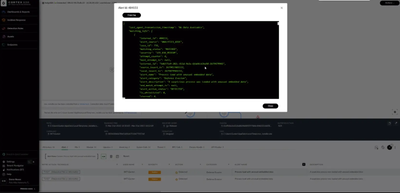
We were reviewing the latest MITRE results and Palo Alto kicked butt! However, looking through the screenshots https://attackevals.mitre-engenuity.org/results/enterprise?vendor=paloaltonetworks&evaluation=turla&... we don't have the same green alert log screen in our Cortex XDR console.
Does anyone know how to get this screen to show up when looking at an alert?
Accepted Solutions
- Mark as New
- Subscribe to RSS Feed
- Permalink
09-21-2023 09:58 PM
Hi @cdeter ,
Thank you for writing to the live community!
The green alert log shows the debug data collected by Cortex XDR agent with respect to the endpoint data collection to stitch an alert. You can get the same data when you forward alerts to your mailbox.
Alternatively, if you want to look at this data on the Cortex XDR console, you can follow the below:
- Navigate to the alert you want to see the debug data for.
- Press the Alt key(for Windows)/option key(for MacOS)
- Right click along with the alt/option key pressed. You should have multiple options coming through
- Scroll down to the last option and you should be able to see Debug Alert option.
Hope this helps!
Please mark the response as "Accept as Solution" if it answers your query.
- Mark as New
- Subscribe to RSS Feed
- Permalink
04-09-2024 01:44 PM
Estimados, para la version Cortex XDR agent 8.3 fue deshabilitado? ya que no aparece dicha opcion "debug log" haciendo clic derecho.
Saludos.
- Mark as New
- Subscribe to RSS Feed
- Permalink
04-09-2024 01:51 PM
Hola @Germain_Prieto, la función indicada por @neelrohit puede verse en la consola de XDR, en la vista de Alertas. No es una función del agente.
- 1 accepted solution
- 2967 Views
- 4 replies
- 1 Likes
Show your appreciation!
Click Accept as Solution to acknowledge that the answer to your question has been provided.
The button appears next to the replies on topics you’ve started. The member who gave the solution and all future visitors to this topic will appreciate it!
These simple actions take just seconds of your time, but go a long way in showing appreciation for community members and the LIVEcommunity as a whole!
The LIVEcommunity thanks you for your participation!
- Cortex XSIAM XQL: How to find incidents where playbook failed / errored? in Cortex XSIAM Discussions
- How to find the assets that do not have XDR agent installed in new Cortex 4.x version ? in Cortex XDR Discussions
- XSOAR - Scaling for pop-up windows and drop-down menus in Cortex XSOAR Discussions
- USB Flash Drives in Cortex XSIAM Discussions
- where to find more Information about event types and event sub types in event metadata of Cortex XDR agent. in Cortex XDR Discussions


