- Access exclusive content
- Connect with peers
- Share your expertise
- Find support resources
Click Preferences to customize your cookie settings.
Unlock your full community experience!
Interface Statistics?
- LIVEcommunity
- Discussions
- General Topics
- Interface Statistics?
- Subscribe to RSS Feed
- Mark Topic as New
- Mark Topic as Read
- Float this Topic for Current User
- Printer Friendly Page
Interface Statistics?
- Mark as New
- Subscribe to RSS Feed
- Permalink
08-22-2013 07:08 AM
Is it only possible to view interface statistics if QoS is enabled on the interface?
Mike
- Labels:
-
Networking
- Mark as New
- Subscribe to RSS Feed
- Permalink
08-22-2013 09:52 AM
On the cli you can see the statistics on any port with or without cos enabled.
pan>show interface ethernet1/1
--------------------------------------------------------------------------------
Name: ethernet1/1, ID: 16
Link status:
Runtime link speed/duplex/state: 1000/full/up
Configured link speed/duplex/state: 1000/full/up
MAC address:
Port MAC address 00:1b:17:01:35:10
Operation mode: layer3
Untagged sub-interface support: no
--------------------------------------------------------------------------------
Name: ethernet1/1, ID: 16
Operation mode: layer3
Virtual router PCI-PL-vr
Interface MTU 1500
Interface IP address: 10.24.32.7/23
Interface management profile: Allow_ping
ping: yes telnet: no ssh: no http: no https: no
snmp: no response-pages: no userid-service: no
Service configured:
Zone: PCI-PL-Outside, virtual system: vsys1
Adjust TCP MSS: no
--------------------------------------------------------------------------------
--------------------------------------------------------------------------------
Physical port counters read from MAC:
--------------------------------------------------------------------------------
rx-broadcast 130264
rx-bytes 1352921351
rx-multicast 600048
rx-unicast 1544405
tx-broadcast 14696
tx-bytes 1816576
tx-multicast 0
tx-unicast 13688
--------------------------------------------------------------------------------
Hardware interface counters read from CPU:
--------------------------------------------------------------------------------
bytes received 49992576
bytes transmitted 1266684
packets received 777517
packets transmitted 28384
receive errors 0
packets dropped 0
--------------------------------------------------------------------------------
Logical interface counters read from CPU:
--------------------------------------------------------------------------------
bytes received 49992576
bytes transmitted 1266684
packets received 777517
packets transmitted 28384
receive errors 0
packets dropped 70438
packets dropped by flow state check 0
forwarding errors 0
no route 42
arp not found 0
neighbor not found 0
neighbor info pending 0
mac not found 0
packets routed to different zone 0
land attacks 0
ping-of-death attacks 0
teardrop attacks 0
ip spoof attacks 0
mac spoof attacks 0
ICMP fragment 0
layer2 encapsulated packets 0
layer2 decapsulated packets 0
--------------------------------------------------------------------------------
ACE PanOS 6; ACE PanOS 7; ASE 3.0; PSE 7.0 Foundations & Associate in Platform; Cyber Security; Data Center
- Mark as New
- Subscribe to RSS Feed
- Permalink
08-22-2013 02:34 PM
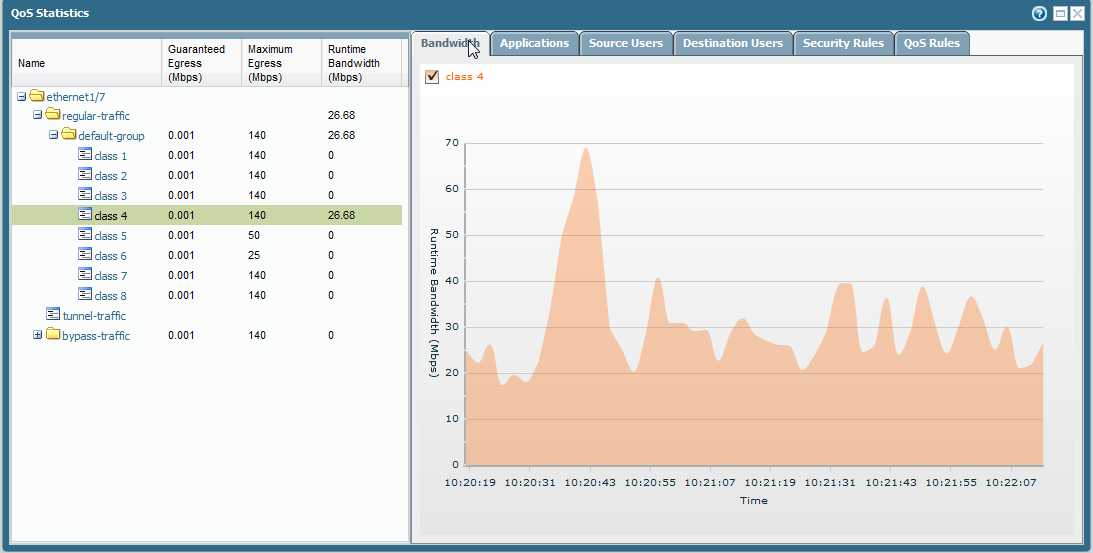
Thanks for the info, but that's not really what I'm looking for. The statistics page on a QoS interface is what I'm not finding anywhere (except if QoS is enabled). It shows bandwidth, users, applications, etc. - things I'd expect to be able to see for an interface on this type of system. Although you can't arrange the columns which is strange.
- Mark as New
- Subscribe to RSS Feed
- Permalink
08-22-2013 04:10 PM
No Currently there is no way to build a QoS Report or statistics.
Look at the following posts
https://live.paloaltonetworks.com/message/31598#31598
https://live.paloaltonetworks.com/message/31127#31127
However if you are looking for data you can look at the ACC tab which shows you which application used how many session or bytes and many more details.

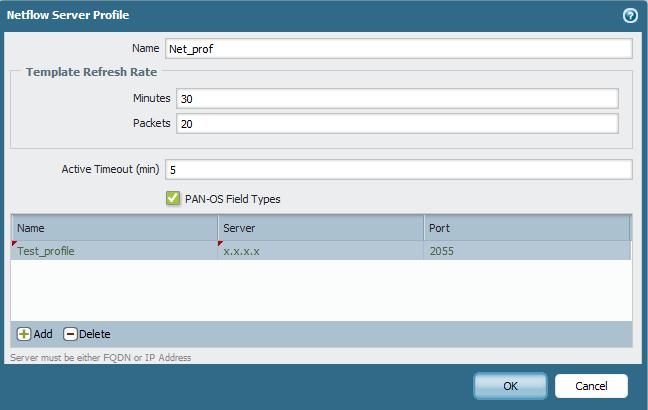
Also you can setup netflow profile on an interface as well.
Here is how to setup Netflow
Step1:
Configure Netflow Server Profile under
Device--> Server profiles ---> Netflow
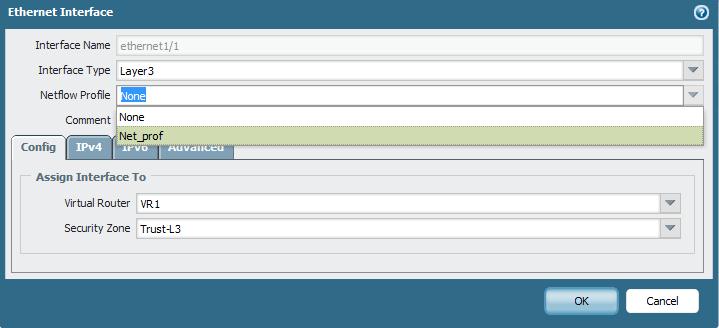
Step2:
Once the Server profile has been configured you Add that to the interface under
- Network-----> Interface
Select the interface for which you want data to be sent to net flow server.
Step 3:
Commit your changes
Let us know if this helps you.
Thanks
Numan
- Mark as New
- Subscribe to RSS Feed
- Permalink
08-22-2013 04:44 PM
Doesnt the chrome plugin found in devcenter display interface statistics?
- Mark as New
- Subscribe to RSS Feed
- Permalink
08-23-2013 09:23 AM
That's helpful, but still not what I'm looking for. The system just doesn't have it built-in and I'm not sure why that is. This is what QoS Statistics looks like. Why isn't this available on all interfaces?

Mike
- Mark as New
- Subscribe to RSS Feed
- Permalink
08-23-2013 04:58 PM
Hi Mike,
That sounds like a great feature request. I would encourge you to get in touch with you Local Sales Engineer so he can request the feature on your Behalf.
Thanks
Numan
- Mark as New
- Subscribe to RSS Feed
- Permalink
08-24-2013 04:17 PM
For a live, continuously-updating view of all network interface throughput numbers (useful when trying to locate intermittent traffic spikes that are impacting firewall performance) run:
show system state browser
Type Shift L and select Port Stats, type “y”, type “u”
To modify the screen refresh rate (default 5 seconds) hit “r”
This doesn't give historical statistics but can provide them in real time.
- Mark as New
- Subscribe to RSS Feed
- Permalink
08-26-2013 01:19 AM
Hi all,
Have you try to use the chrome plugin ?
You can find it here: https://live.paloaltonetworks.com/docs/DOC-4581
It's a great tool and can be modify if needed.
Hope help.
V.
- Mark as New
- Subscribe to RSS Feed
- Permalink
08-26-2013 08:47 AM
The chrome plugin is okay, but not what I want. It would be great if you could click an interface and drill down into the details - applications, source users, etc., but again, this should be a built-in part of the system.
I'll talk to my sales rep. about it.
Mike
- Mark as New
- Subscribe to RSS Feed
- Permalink
08-27-2013 03:05 AM
Hi,
Correct, fell free to make changes and add-on .... and share it 🙂
V.
- 10243 Views
- 10 replies
- 1 Likes
Show your appreciation!
Click Accept as Solution to acknowledge that the answer to your question has been provided.
The button appears next to the replies on topics you’ve started. The member who gave the solution and all future visitors to this topic will appreciate it!
These simple actions take just seconds of your time, but go a long way in showing appreciation for community members and the LIVEcommunity as a whole!
The LIVEcommunity thanks you for your participation!
- Global Protect count current users not match statistics in GlobalProtect Discussions
- PAN-308564 Known Issue in Advanced SD-WAN for NGFW Discussions
- Is the unified RPC interface (MonitorDirect.enqueueLogRequest) supported for external use? in Next-Generation Firewall Discussions
- Palo Windows ARP Issue - Windows Hosts Not Installing ARP info in Next-Generation Firewall Discussions
- Existing traffic stops suddenly, and changing of interface MTU resolved it. in General Topics


