- Access exclusive content
- Connect with peers
- Share your expertise
- Find support resources
Click Preferences to customize your cookie settings.
Unlock your full community experience!
User usage report only shows data for a week in Network Monitor under App scope
- LIVEcommunity
- Discussions
- General Topics
- Re: User usage report only shows data for a week in Network Monitor under App scope
- Subscribe to RSS Feed
- Mark Topic as New
- Mark Topic as Read
- Float this Topic for Current User
- Printer Friendly Page
- Mark as New
- Subscribe to RSS Feed
- Permalink
05-09-2022 12:02 AM
Hi Guys,
Source User report only shows data for a week in Network Monitor under App scope while there are logs available for a month.
However, reports can be seen for a month when filtered by the Application.
Logging and reporting settings are set as per normal
Many thanks in advance
Regards,
Accepted Solutions
- Mark as New
- Subscribe to RSS Feed
- Permalink
05-11-2022 01:37 AM
Hey @Pras;
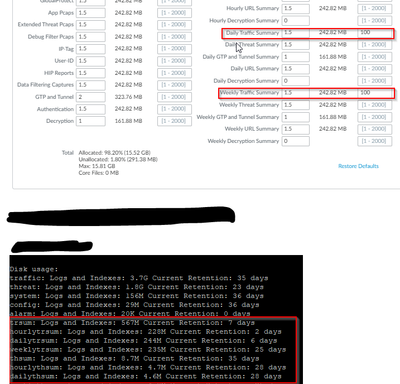
The values reported in that section of the output of "show system logdb-quota" are the actual usage, not the configured values. That section is telling you that based on the storage quota provided, it's managed to store x number of days of that type of log.
For example, in the case of Daily Traffic Summary you have 242MB and 100 days configured. Based on the CLI output, with 242MB available for that type of log, the firewall is able to store 6 days worth of Daily Traffic Summary logs. You can then roughly figure out that if you want to actually retain 100 days worth of Daily Traffic Summary logs you'll need to increase the percentage of the disk allocated to that type of log.
In this case, to keep 100 days of Daily Threat Summary logs you'd need to increase its quota to about 4GB.
Since the logging disk on this firewall is relatively very small, my recommendation is that you configure log forwarding to something dedicated for log storage and query like Panorama, or forwarding via Syslog for example to a SIEM.
- Mark as New
- Subscribe to RSS Feed
- Permalink
05-09-2022 02:41 AM
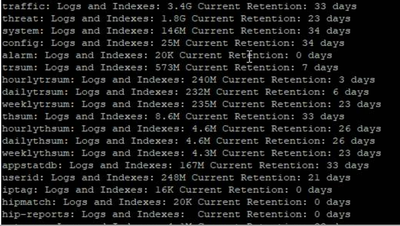
For reference, that's quite a small logging disk - what model and version of PAN-OS is this?
Could you provide the output of
> show system logdb-quota
Particularly, the part showing the number of days stored for each log type would be useful to know. Here's an excerpt from my home VM-100:
Disk usage:
traffic: Logs and Indexes: 423M Current Retention: 90 days
threat: Logs and Indexes: 156M Current Retention: 95 days
system: Logs and Indexes: 579M Current Retention: 90 days
config: Logs and Indexes: 45M Current Retention: 74 days
alarm: Logs and Indexes: 24K Current Retention: 0 days
trsum: Logs and Indexes: 357M Current Retention: 90 days
hourlytrsum: Logs and Indexes: 291M Current Retention: 89 days
dailytrsum: Logs and Indexes: 153M Current Retention: 58 days
weeklytrsum: Logs and Indexes: 57M Current Retention: 85 days
- Mark as New
- Subscribe to RSS Feed
- Permalink
05-09-2022 03:34 PM
Thanks for your response, please find below
- Mark as New
- Subscribe to RSS Feed
- Permalink
05-09-2022 07:44 PM - edited 05-19-2022 04:51 PM
.
- Mark as New
- Subscribe to RSS Feed
- Permalink
05-09-2022 10:32 PM
I checked on my PA running 10.1.4-h4 no issues.
Which PAN OS version you are running?
Regards
Help the community: Like helpful comments and mark solutions.
- Mark as New
- Subscribe to RSS Feed
- Permalink
05-10-2022 06:16 PM - edited 05-10-2022 08:11 PM
Hi @MP18 ,
Is your disk quota the same as mine?
@KieraMitchell How to change the disk quota? After changing the days on GUI, it is not reflected when viewed through CLI (after commit)
Thanks
- Mark as New
- Subscribe to RSS Feed
- Permalink
05-11-2022 01:37 AM
Hey @Pras;
The values reported in that section of the output of "show system logdb-quota" are the actual usage, not the configured values. That section is telling you that based on the storage quota provided, it's managed to store x number of days of that type of log.
For example, in the case of Daily Traffic Summary you have 242MB and 100 days configured. Based on the CLI output, with 242MB available for that type of log, the firewall is able to store 6 days worth of Daily Traffic Summary logs. You can then roughly figure out that if you want to actually retain 100 days worth of Daily Traffic Summary logs you'll need to increase the percentage of the disk allocated to that type of log.
In this case, to keep 100 days of Daily Threat Summary logs you'd need to increase its quota to about 4GB.
Since the logging disk on this firewall is relatively very small, my recommendation is that you configure log forwarding to something dedicated for log storage and query like Panorama, or forwarding via Syslog for example to a SIEM.
- Mark as New
- Subscribe to RSS Feed
- Permalink
05-11-2022 10:52 AM - edited 05-11-2022 10:55 AM
My daily traffic summary is % 1.5 69.11 MB and max days tab has no value.
Also my Logging and storage value is below on PA 220.
It might be different depending on the hardware
|
Log Storage
|
|
Regards
Help the community: Like helpful comments and mark solutions.
- Mark as New
- Subscribe to RSS Feed
- Permalink
05-12-2022 04:23 PM
Thanks, @MP18
@KieraMitchell Nice explanation, I now understand it better. This means to see the usage of users under the app scope for more days, we need to make sure the daily traffic summary storage is more, yeah?
- 1 accepted solution
- 7094 Views
- 10 replies
- 0 Likes
Show your appreciation!
Click Accept as Solution to acknowledge that the answer to your question has been provided.
The button appears next to the replies on topics you’ve started. The member who gave the solution and all future visitors to this topic will appreciate it!
These simple actions take just seconds of your time, but go a long way in showing appreciation for community members and the LIVEcommunity as a whole!
The LIVEcommunity thanks you for your participation!
- HA failover on Acitve Passive concerns in Next-Generation Firewall Discussions
- [SOLVED] Panorama's SAML-Based Administrator Cannot See Other Administrators And Generate TSFs in Panorama Discussions
- Panorama PDF summary report of 1 week/month in Panorama Discussions
- Automatic report on base image vulnerabilities in Prisma Cloud Discussions
- GlobalProtect 6.1.11-175 Connection Issues in GlobalProtect Discussions


