- Access exclusive content
- Connect with peers
- Share your expertise
- Find support resources
Click Preferences to customize your cookie settings.
Unlock your full community experience!
Where to see graphs of peak bandwidth usage?
- LIVEcommunity
- Discussions
- Network Security
- Next-Generation Firewall Discussions
- Where to see graphs of peak bandwidth usage?
- Subscribe to RSS Feed
- Mark Topic as New
- Mark Topic as Read
- Float this Topic for Current User
- Printer Friendly Page
Where to see graphs of peak bandwidth usage?
- Mark as New
- Subscribe to RSS Feed
- Permalink
03-22-2023 09:07 PM
Hi, I'm new to using PaloAlto devices, we have PA-440's and don't use panorama.
We are moving internet providers so in deciding what type of connection to purchase I need to see some graphing of our internet bandwidth usage of all traffic in and out on the internet interface.
I've seen the bandwidth graphs under Network - QoS, but they only seem to show realtime and not the last day/week/month, etc.
I've seen the Monitor - App Scope - Network Monitor graphs but they are averages over a time period (changing depending on timeframe is chosen).
The CLI 'show system statistics session' is no use as is only an instant in time.
I'm wanting to see the instantaneous peaks over time in some graph, can someone tell me how please?
Regards, Bryce.
- Mark as New
- Subscribe to RSS Feed
- Permalink
03-23-2023 11:38 PM - edited 03-27-2023 02:14 AM
Interesting question 🙂
From what I see from old posts about the same better use external monitoring system like nagios for example to have global not per application reports:
https://live.paloaltonetworks.com/t5/general-topics/pan-bandwidth-monitoring-reporting/td-p/7177
For a specific interface maybe this will work:
---
You can add same filters to Query Builder box that you use in
Monitor > Logs > Traffic
For example ( zone.src eq INSIDE ) and ( zone.dst eq OUTSIDE )
----
Also you may try achrome extension but with newer F5 versions there are issues with it. Other than that maybe try the AIOPS feature and see what it has.
https://docs.paloaltonetworks.com/aiops/aiops-for-ngfw/get-started-with-aiops/activate
You may search the comunity discussions for more answers as it seems that many people have asked this question 🙂
- Mark as New
- Subscribe to RSS Feed
- Permalink
03-29-2023 02:34 PM
Thanks for links. I have been searching community also. Nothing seems to make it easy, the most promising was the achrome addon but comments say it doesn't work with PA versions 9 or 10.
The cacti solution seems too much overhead and setup for wanting such a simple statistic/graph output.
Other solutions all seem to give averages, I need to know my peaks to size the pipe appropriately.
I would have expected the firewall to be able to give this info, especially since it already knows this data in real time and can display that, so very disappointed 😞
- Mark as New
- Subscribe to RSS Feed
- Permalink
03-29-2023 05:48 PM - edited 03-29-2023 05:57 PM
ACC tab will show you how much data in GB was transferred in 15 minute increments.
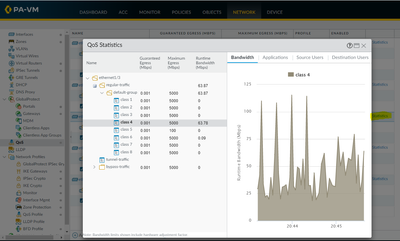
Network > QoS > Statistics will show you how much data will exit interface in real time (QoS applies to egress interface).
Unless QoS policy classifies traffic to different class all traffic is in class 4 by default.
You can also see interface throughput in cli following https://knowledgebase.paloaltonetworks.com/KCSArticleDetail?id=kA10g000000Clj0CAC
For historic data you need to use external monitoring that will poll data over SNMP.
Palo Alto Networks certified from 2011
- Mark as New
- Subscribe to RSS Feed
- Permalink
03-29-2023 06:22 PM
Thanks Raido, but the 15 minute intervals is too broad to see what sort of peaks may have occurred in that time. If I had 1GB of data in 15 minute period was that 1MB/sec fairly constantly or was that peaks of 50MB/sec for only 20 seconds or so, very different as to what type of connection I will require. Several broadband providers asked for our bandwidth peaks in per second intervals to size the pipe properly.
We don't have external monitoring nor do we use of SNMP so can't do that. Going on previous experience with watchguard and microtik devices I thought this sort of statistic would have come as part of the device, especially as it can already show realtime statistic.
Maybe there is a feature enhancement list somewhere this could be added to? (but that won't help my situation today).
Cheers, Bryce.
- Mark as New
- Subscribe to RSS Feed
- Permalink
12-06-2024 02:33 AM
So it is not possible to view a line graph displaying throughput in Mbps/Gbps?
Cant seem to do this and running 11.2.4. Anyone know if PA are planning on adding this visibility? Their competitors can do this.
- Mark as New
- Subscribe to RSS Feed
- Permalink
01-14-2026 01:28 AM
Dear All,
I am not sure are you guys still looking for a solution to see live network bandwidth monitoring.
I have developed a tool which is free to use and see the paloalto live dashboard for top bandwidth users.
https://netarhaam.github.io/netarhaam-dashboard/index.html
- 55399 Views
- 6 replies
- 0 Likes
Show your appreciation!
Click Accept as Solution to acknowledge that the answer to your question has been provided.
The button appears next to the replies on topics you’ve started. The member who gave the solution and all future visitors to this topic will appreciate it!
These simple actions take just seconds of your time, but go a long way in showing appreciation for community members and the LIVEcommunity as a whole!
The LIVEcommunity thanks you for your participation!
- High Data Plane Utilization During Business Hours in Next-Generation Firewall Discussions
- Can we set data cap with QOS in Palo Alto for an app-id in Next-Generation Firewall Discussions
- Root Partition Full in Next-Generation Firewall Discussions
- PA vm series - CPU history usage in graph in Next-Generation Firewall Discussions
- Data cap limits for users in specific network in Next-Generation Firewall Discussions


