- Access exclusive content
- Connect with peers
- Share your expertise
- Find support resources
Click Preferences to customize your cookie settings.
Unlock your full community experience!
Data plane - usage
- LIVEcommunity
- Discussions
- General Topics
- Re: Data plane - usage
- Subscribe to RSS Feed
- Mark Topic as New
- Mark Topic as Read
- Float this Topic for Current User
- Printer Friendly Page
- Mark as New
- Subscribe to RSS Feed
- Permalink
10-20-2016 09:57 AM
Lots of things actually. Do you have more sessions going through the data plane for some reason, did someone install something that is chatting to another zone, are people streaming more media, software bug? I think the first thing to look at would be if your session count is higher than it normally is and go from there.
- Mark as New
- Subscribe to RSS Feed
- Permalink
10-20-2016 11:39 AM
so where is the best place to see if you session count has increased?
- Mark as New
- Subscribe to RSS Feed
- Permalink
10-20-2016 11:33 PM
Automatic reports are good way to start. Traffic reports in particular.
- Mark as New
- Subscribe to RSS Feed
- Permalink
10-21-2016 07:07 AM
I think I am going to have to create a custome report I don't see any of the premade report with what I need. They show total sessions but does not show how it increases over time
- Mark as New
- Subscribe to RSS Feed
- Permalink
10-21-2016 07:16 AM
I am not finding a graph of any sort in the reports that show the increase of session unless I am missing something
- Mark as New
- Subscribe to RSS Feed
- Permalink
10-21-2016 07:18 AM
If you have already been monitoring total bandwidth usage or application statistics you could get the same information in a more round-about way.
- Mark as New
- Subscribe to RSS Feed
- Permalink
10-21-2016 07:28 AM
Can you give me an example?
- Mark as New
- Subscribe to RSS Feed
- Permalink
10-21-2016 01:00 PM
If you have reports for application statistics along with sorting by the number of sessions then you can somewhat monitor the number of sessions on your network. I've included a screenshot of how I have mine setup. To the best of my knowledge you can't have a report for the number of sessions. We use the API to pull the output and save it to a text document so that we can somewhat manuanually monitor it if needed.
- Mark as New
- Subscribe to RSS Feed
- Permalink
10-21-2016 01:38 PM
So this is a custom report? Let me see if I can configure something similar thanks. I will let you know if it gives me what I need
- Mark as New
- Subscribe to RSS Feed
- Permalink
10-21-2016 01:42 PM
I tried that and at first glance this is something I would have to run regularly and then compare numbers of previous report to see if things are increasing. It would probably work I was just wanting something in a line graph no bar graphs so I can see an overall increase
- Mark as New
- Subscribe to RSS Feed
- Permalink
10-21-2016 01:55 PM
Okay. Closest thing to that would be the Pan(w)achrome extension for Google Chrome; that will give you basic information such as bandwidth and session as long as you allow it access to your firewall with your credentials. That sounds like something more that your looking for, however it still doesn't keep track of historical information for very long as all; for that you would probably be looking at something like SolarWinds
- Mark as New
- Subscribe to RSS Feed
- Permalink
10-21-2016 02:39 PM
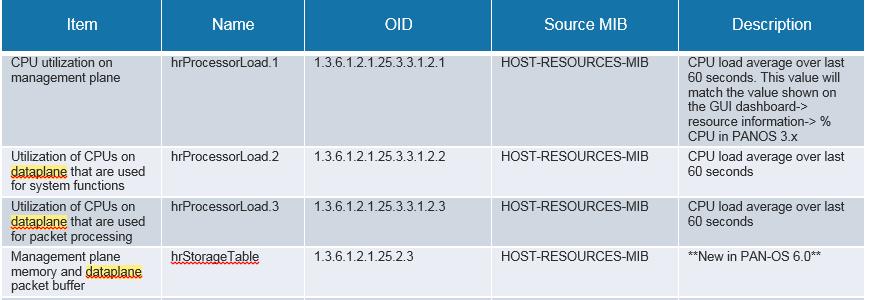
I've referenced it before (a monitoring best practices' doc from palo), but if you've got any sort of Network Management you can use these MIBs to chart exactly what you're looking for:
- Mark as New
- Subscribe to RSS Feed
- Permalink
10-24-2016 04:15 AM
Hi,
Have you tried SNMP monitoring ? As Brandon points out in the previous comment you should get plenty of info with OID and SNMP monitoring. You will need a network monitoring tool like Cacti (I just picked a random one).
This might be useful :
SNMP-for-Monitoring-Palo-Alto-Networks-Devices
Cheers,
Kiwi
Please help out other users and “Accept as Solution” if a post helps solve your problem !
Read more about how and why to accept solutions.
- 7261 Views
- 13 replies
- 0 Likes
Show your appreciation!
Click Accept as Solution to acknowledge that the answer to your question has been provided.
The button appears next to the replies on topics you’ve started. The member who gave the solution and all future visitors to this topic will appreciate it!
These simple actions take just seconds of your time, but go a long way in showing appreciation for community members and the LIVEcommunity as a whole!
The LIVEcommunity thanks you for your participation!
- HA failover on Acitve Passive concerns in Next-Generation Firewall Discussions
- Palo Alto 3410 Firewall 100% DP CPU spike in Next-Generation Firewall Discussions
- Cloud NGFW: Mandatory Panorama Upgrade to 11.2.7-h4 or higher for managing Cloud NGFW Firewalls. in General Topics
- CUSTOMER ADVISORY: Required Action for Azure hosted VM-Series & AIRS Instances in VM-Series in the Public Cloud
- pa-450 issues and going down 2 days in a row in General Topics


