- Access exclusive content
- Connect with peers
- Share your expertise
- Find support resources
Click Preferences to customize your cookie settings.
Unlock your full community experience!
How to Fix High CPU Usage on Palo Alto PAN-2020
- LIVEcommunity
- Discussions
- General Topics
- Re: How to Fix High CPU Usage on Palo Alto PAN-2020
- Subscribe to RSS Feed
- Mark Topic as New
- Mark Topic as Read
- Float this Topic for Current User
- Printer Friendly Page
How to Fix High CPU Usage on Palo Alto PAN-2020
- Mark as New
- Subscribe to RSS Feed
- Permalink
02-06-2014 02:28 AM
- Mark as New
- Subscribe to RSS Feed
- Permalink
02-06-2014 04:50 AM
Start by looking at the cpu resources following this tech document. This will let you know what process is at issue.
How to Interpret: show system resources
ACE PanOS 6; ACE PanOS 7; ASE 3.0; PSE 7.0 Foundations & Associate in Platform; Cyber Security; Data Center
- Mark as New
- Subscribe to RSS Feed
- Permalink
02-06-2014 05:14 AM
Hi Steven,
Thank you for your reply, so i need to launch this commande in order to see what process causing the problem.
Best regards,
- Mark as New
- Subscribe to RSS Feed
- Permalink
02-06-2014 09:35 AM
First of all, we need to identify which CPU is high, MP CPU (management-plane) or DP CPU (data-plane)...?
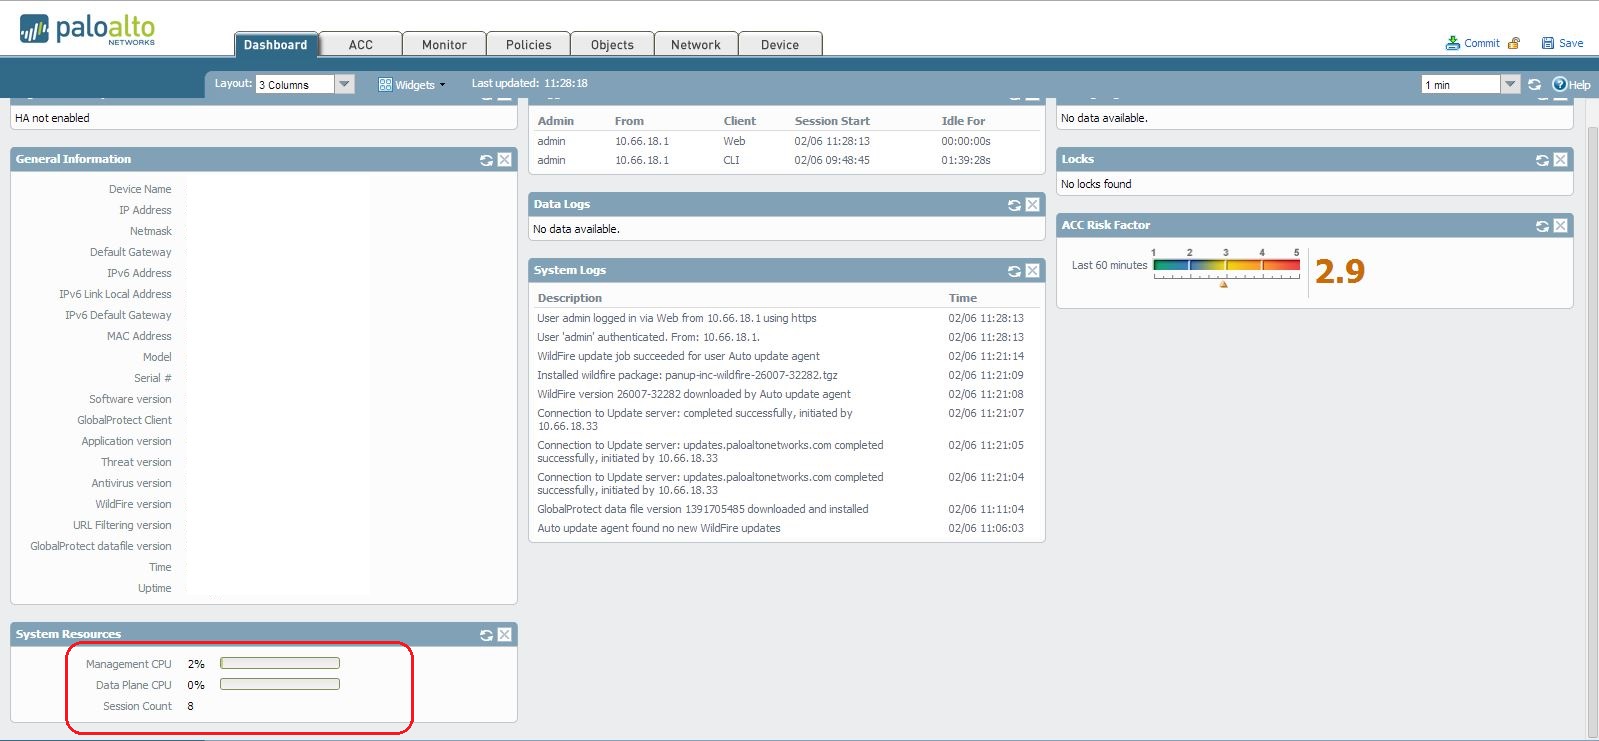
The above documents will help you for MP-CPU. From the GUI of the PAN firewall, if you go to Dashboard >> @ bottom left corner, it will show you the CPU utilization.
Example:

NOTE: To understand DP CPU, you can apply below mentioned CLI commands.
CLI> show running resource-monitor
CLI> show session info
CLI> show session meter
CLI> Debug data-plane pool statistics
CLI>> show counter global filter delta yes >>>>>>>> Run this command 10 times with a 5 sec interval.
Hope this helps.
Thanks
- Mark as New
- Subscribe to RSS Feed
- Permalink
02-06-2014 04:15 PM
What PanOS version are you running, and which CPU is under the load?
If it's the management CPU, and the spike is every 5 minutes or so, there's nothing you can do about it. Version 6 is supposed to help in reducing these spikes, but it's caused by the log index process, which kicks off every 5 minutes, and will normally kick your management CPU up to 60-70% for a couple of minutes.
As I said, V6 is supposed to fix this - haven't installed V6 yet, so I can't comment one way or another if it does.
- 10922 Views
- 4 replies
- 0 Likes
Show your appreciation!
Click Accept as Solution to acknowledge that the answer to your question has been provided.
The button appears next to the replies on topics you’ve started. The member who gave the solution and all future visitors to this topic will appreciate it!
These simple actions take just seconds of your time, but go a long way in showing appreciation for community members and the LIVEcommunity as a whole!
The LIVEcommunity thanks you for your participation!
- Updating Cortex Agent by MDM in Cortex XDR Discussions
- Palo Alto 3410 Firewall 100% DP CPU spike in Next-Generation Firewall Discussions
- Panorama Very Slow on VMware ESXI in Panorama Discussions
- Cortex XDR Tenant Auto-Upgrade 3.17 → 5.0: UI mixed theme, AI pages stuck loading, Marketplace/Playbook Catalog empty + ingestion quota warning in Cortex XDR Discussions
- GlobalProtect Always-On (6.3.3-c711) – Users Stuck in “Connecting” State but Still Have Internet Access in General Topics


