- Access exclusive content
- Connect with peers
- Share your expertise
- Find support resources
Click Preferences to customize your cookie settings.
Unlock your full community experience!
Monitoring HA state with graphite
- LIVEcommunity
- Discussions
- General Topics
- Monitoring HA state with graphite
- Subscribe to RSS Feed
- Mark Topic as New
- Mark Topic as Read
- Float this Topic for Current User
- Printer Friendly Page
Monitoring HA state with graphite
- Mark as New
- Subscribe to RSS Feed
- Permalink
11-28-2016 03:07 AM
Hi there,
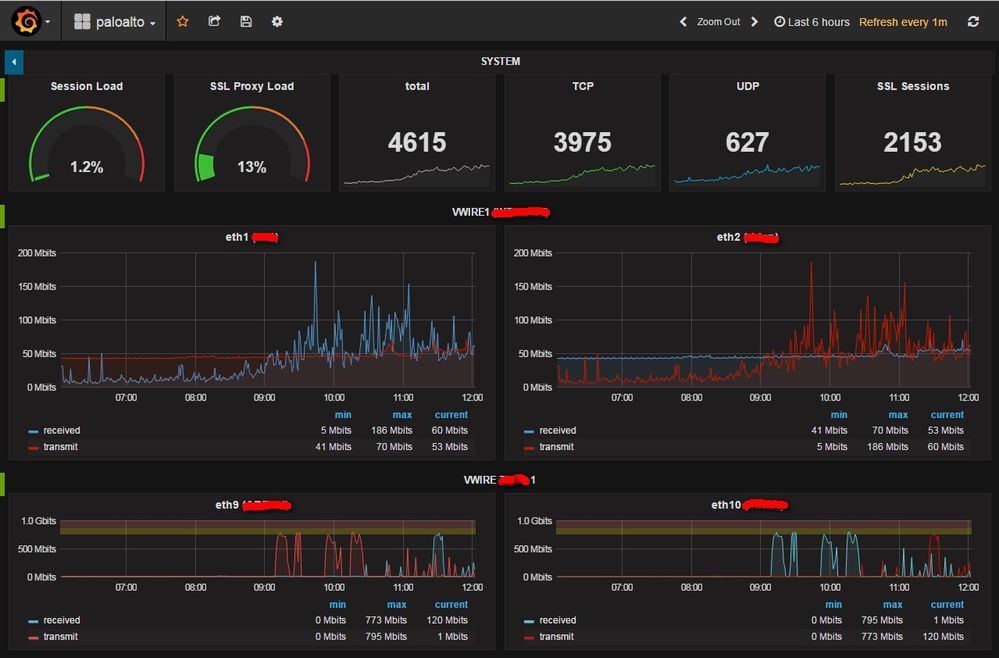
i am currently working on a grafana dashboard to monitor a pa-3xxx cluster. getting numerical values by snmp with collectd is no problem. and it ist great for displaying the data. collectd can't handle strings, but the ha state ist totally string-based. does anybody know a way to get the snmp output parsed an sent into graphite? is there e.g. a perl script or anything else?
dashboard on grafana looks like this:
- Mark as New
- Subscribe to RSS Feed
- Permalink
12-10-2020 05:37 AM
Hello,
I'am not sure i could have thes better response on this topic but it may be help or give the beginning of an answer
for ha state i use nagios plugin check : check_nwc_health
check_nwc_health --hostname @IP --username "XXX" --authpassword "XXX" --privpassword "XXX" --authprotocol sha --privprotocol aes --mode ha-role --timeout 30
this check response OK with active device
if you check if ha peer passive i have add a negate (--negate) on this check
have a nice day
- 2963 Views
- 1 replies
- 0 Likes
Show your appreciation!
Click Accept as Solution to acknowledge that the answer to your question has been provided.
The button appears next to the replies on topics you’ve started. The member who gave the solution and all future visitors to this topic will appreciate it!
These simple actions take just seconds of your time, but go a long way in showing appreciation for community members and the LIVEcommunity as a whole!
The LIVEcommunity thanks you for your participation!
- HA failover on Acitve Passive concerns in Next-Generation Firewall Discussions
- Tuning Panorama HA Timers to Stop False HA1 Alerts over MPLS in Panorama Discussions
- PA440 HA failover not working in General Topics
- Ha2 is going down every 5 6 days .. .my palo version is 10.2.9.h11 in General Topics
- Interface Errors after upgrade - VM Series in Next-Generation Firewall Discussions


