- Access exclusive content
- Connect with peers
- Share your expertise
- Find support resources
Click Preferences to customize your cookie settings.
Unlock your full community experience!
PAN Bandwidth Monitoring & Reporting
- LIVEcommunity
- Discussions
- General Topics
- Re: PAN Bandwidth Monitoring & Reporting
- Subscribe to RSS Feed
- Mark Topic as New
- Mark Topic as Read
- Float this Topic for Current User
- Printer Friendly Page
PAN Bandwidth Monitoring & Reporting
- Mark as New
- Subscribe to RSS Feed
- Permalink
02-21-2014 03:07 AM
Hello,
is there a way to generate a bandwidth usage charts from the web GUI or CLI (in Mbps)? I need to be able to show what applications are consuming bandwidth at certain times during the day.
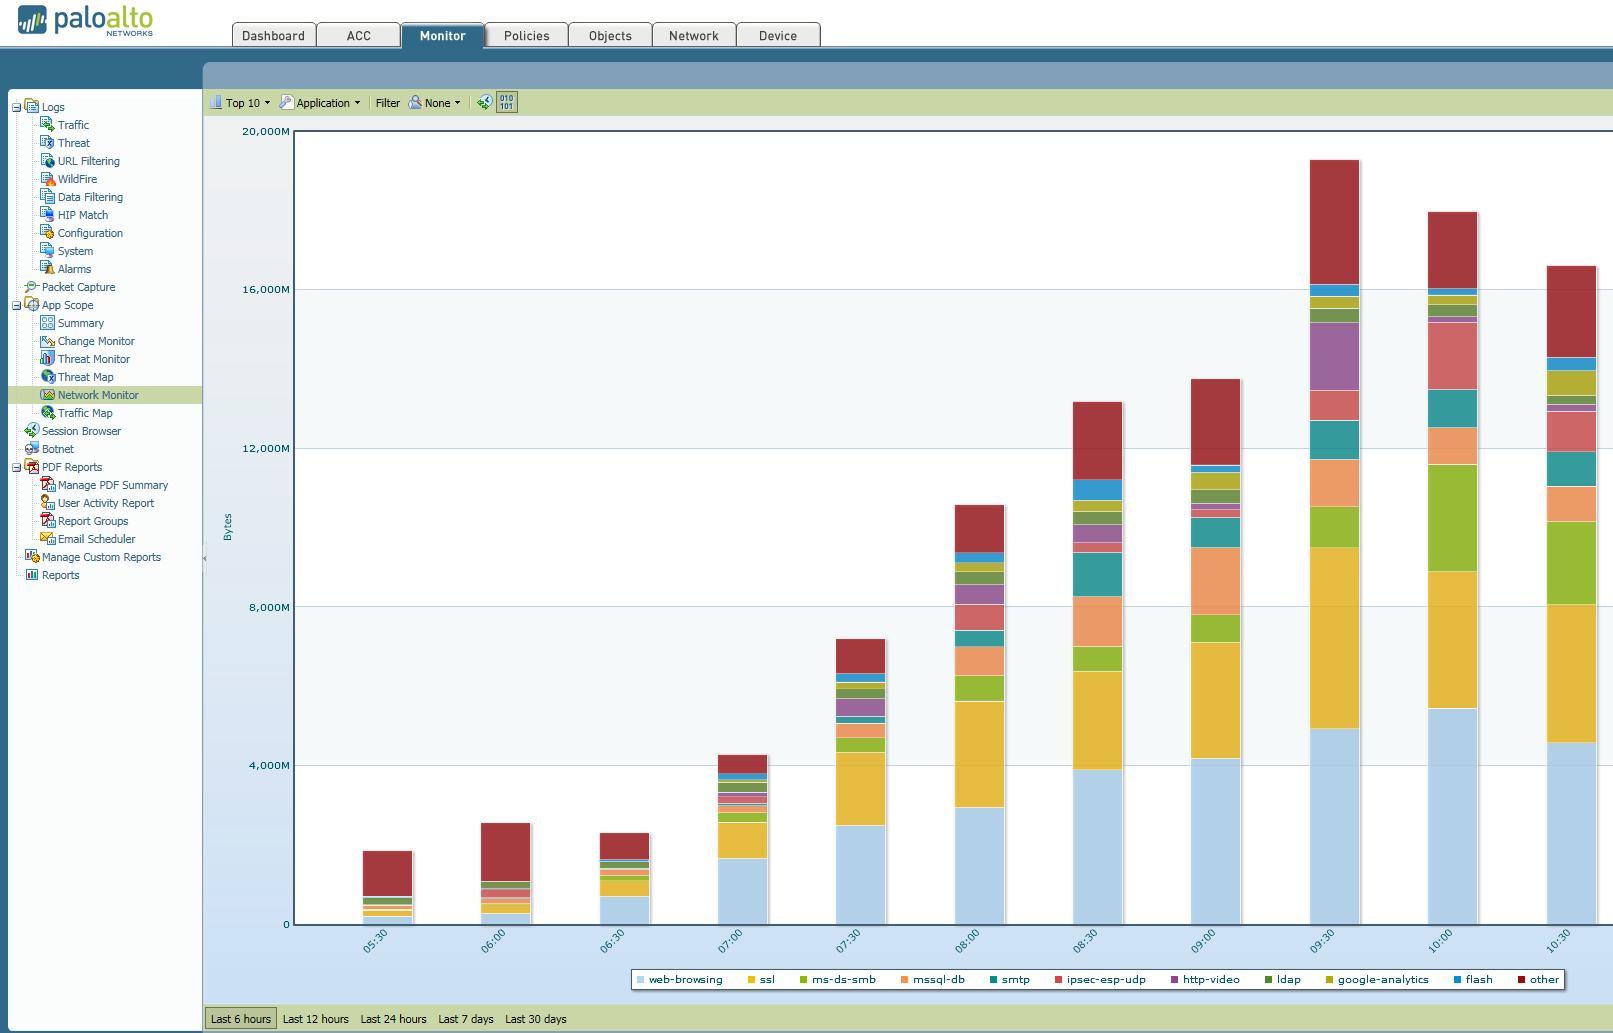
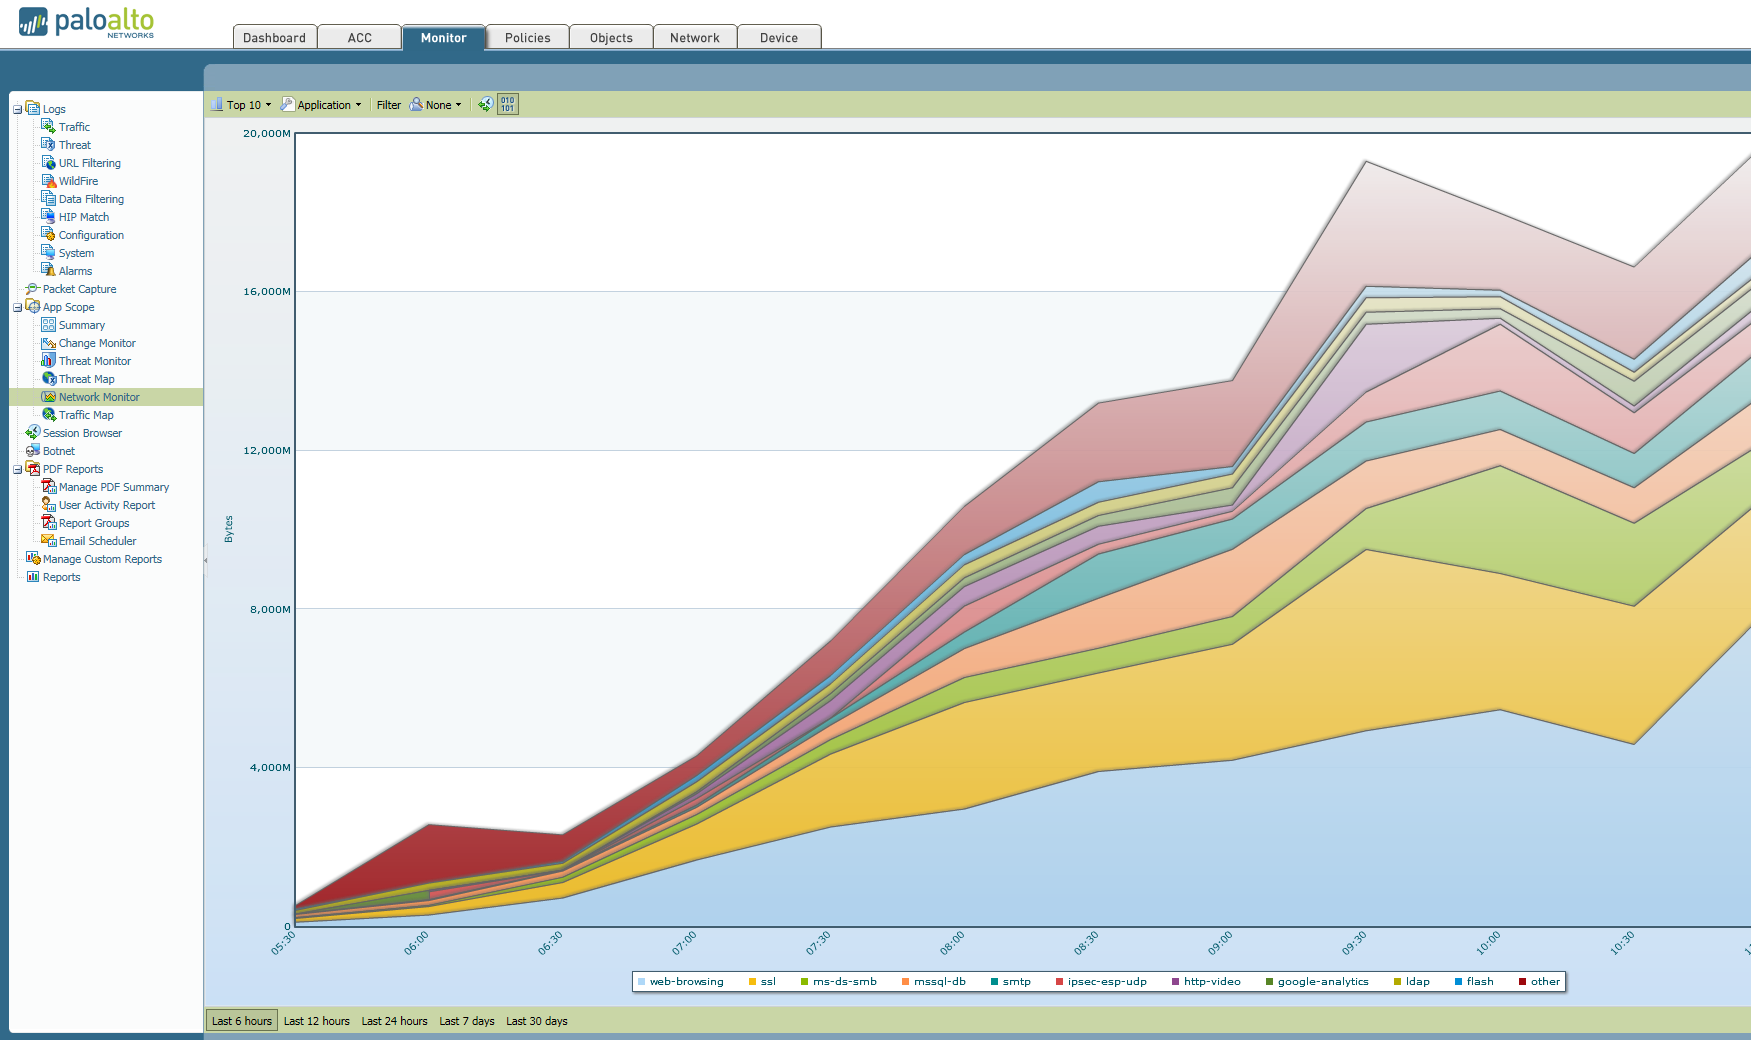
The current usage reports in Network Monitor tool only show throughput per time unit (e.g. hourly total), which is not as intuitive as a bandwidth usage graph in Mbps.
Tuomo Makkonen
- Mark as New
- Subscribe to RSS Feed
- Permalink
02-21-2014 04:16 AM
Hi Tuomo,
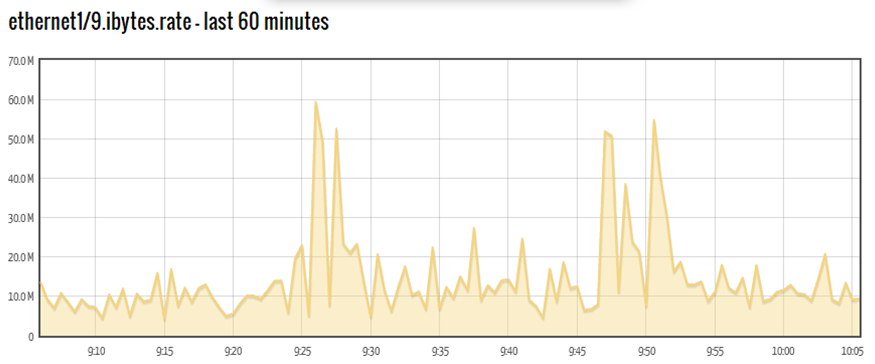
maybe this satisfies you demands

your get more information: https://live.paloaltonetworks.com/docs/DOC-4581
I used it because it is fast and short to get an overview but it is a chrome addon
Cheers Klaus
- Mark as New
- Subscribe to RSS Feed
- Permalink
02-23-2014 03:40 AM
Hi
Think about permanet monitoring usung Cacti or Zabbix
Please read this topics
https://live.paloaltonetworks.com/message/32069#32069
https://live.paloaltonetworks.com/docs/DOC-5636
Regards
SLawek
- Mark as New
- Subscribe to RSS Feed
- Permalink
02-25-2014 01:57 AM
Thanks for the tips! I went through the docs, and it seems like using the Crome plugin, Cacti or Zabbix do not support grouping bandwidth usage by application, they only report the total bandwidth usage. Getting application specific data is the most important feature for me. Do you know of a way how this can be achieved?
- Mark as New
- Subscribe to RSS Feed
- Permalink
02-25-2014 02:24 AM
Hi Tuomo,
if you connected by web-gui choose acc-tab. then it should be sorted by "bytes" and then choose your desired application. what you get are different sorted groups like grouped by zones etc.
Does this fit your needs more?
Cheers Klaus
- Mark as New
- Subscribe to RSS Feed
- Permalink
02-25-2014 02:34 AM
Hi Klaus!
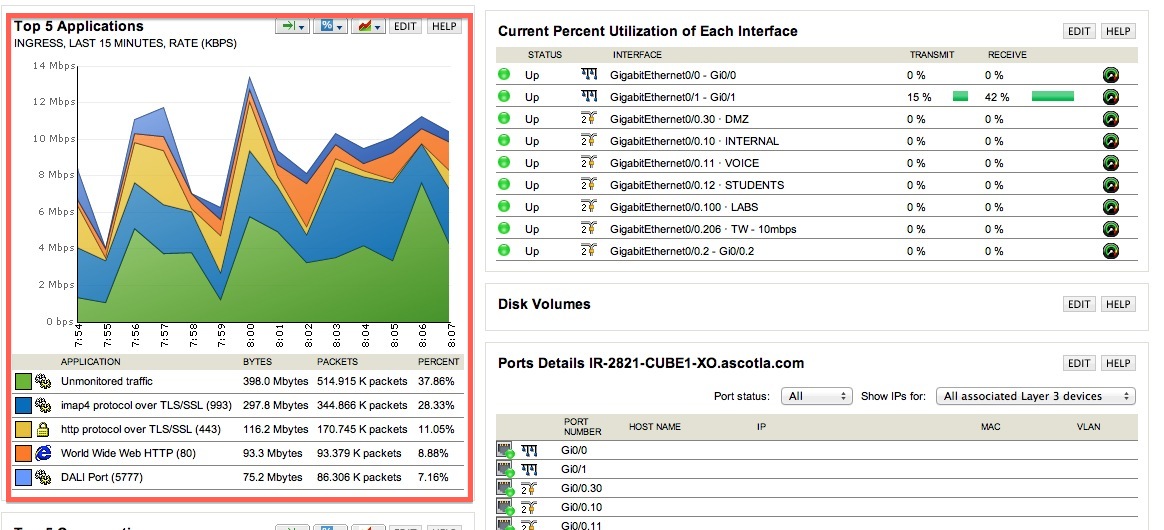
thanks for the help, but that's not quite what I was looking for. I'd like to have a bandwidth usage graph like the one you posted earlier, but also with application id information that PAN provides. Here's a random picture of what i mean:
: 
- Mark as New
- Subscribe to RSS Feed
- Permalink
02-25-2014 02:51 AM
That's close, but that shows the total throughput per application per time unit (in this case, hour). I need to show the customer the total available bandwidth in Y-axis, the time in X-axis and the amount of bandwidth consumed by applications in the graph. IMHO the graph above is not as intuitive, as the Y-axis shows the total compound throughput, and the bandwidth usage in Mbps must be calculated manually.
- Mark as New
- Subscribe to RSS Feed
- Permalink
02-25-2014 02:56 AM
BTW, how do you interpret that graph? For example, at 9:30 the bytes count is about 19000M. I assume it means that the total throughput between 9:00-9:30 was 19000M, is that correct?
- Mark as New
- Subscribe to RSS Feed
- Permalink
02-25-2014 03:08 AM
for me these are the traffic shares of the different apps and has unfortunately nothing to do with bandwidth of a certain line. this could be something for a request and i guess it should be possible to realize for PA.
- Mark as New
- Subscribe to RSS Feed
- Permalink
02-26-2014 06:39 AM
kdd set up Zabbix and you can have lots of pretty graphs and trends. There's a learning curve to it but it's not insurmountable.
- Mark as New
- Subscribe to RSS Feed
- Permalink
02-26-2014 07:48 AM
kdd with some extra work you can even graph IPsec tunnel bandwidth if that's something valuable to you... see Integrating Zabbix and PA subinterfaces via API and my comments
- 28484 Views
- 12 replies
- 0 Likes
Show your appreciation!
Click Accept as Solution to acknowledge that the answer to your question has been provided.
The button appears next to the replies on topics you’ve started. The member who gave the solution and all future visitors to this topic will appreciate it!
These simple actions take just seconds of your time, but go a long way in showing appreciation for community members and the LIVEcommunity as a whole!
The LIVEcommunity thanks you for your participation!
- SD-WAN with ION's running 6.5.1-b5 performance issues in Prisma SD-WAN Discussions
- Not Receiving Bandwidth Capacity from SD-WAN Monitoring API in Prisma SD-WAN Discussions
- Prisma SD-WAN monitoring API's in Prisma SD-WAN Discussions
- Can I use SCM Pro only for log connection purposes? in Strata Cloud Manager
- Prisma Speed and Bandwidth Monitor in General Topics


