- Access exclusive content
- Connect with peers
- Share your expertise
- Find support resources
Click Preferences to customize your cookie settings.
Unlock your full community experience!
Sizing PA Devices
- LIVEcommunity
- Discussions
- General Topics
- Re: Sizing PA Devices
- Subscribe to RSS Feed
- Mark Topic as New
- Mark Topic as Read
- Float this Topic for Current User
- Printer Friendly Page
Sizing PA Devices
- Mark as New
- Subscribe to RSS Feed
- Permalink
03-12-2012 05:44 AM
I need to know if there is any report/graf in PA that shows the throughput peak, simultaneus session peak, in a custom time period. This would be great for sizing equipment after analizing the traffic of a costumer during some days. It will be very usefull to know how are you using your equipment and the grow prosibilities you have.
I have been looking in PA reports and found no information about throuput, session, cpd usage peaks.
Thanks in advance for your help.
Albert
- Mark as New
- Subscribe to RSS Feed
- Permalink
03-12-2012 02:21 PM
I think there would be some custom report you should be able to setup to get these figures but I guess you want them more in realtime?
Using netflow export could be one way to achieve this, otherwise I think snmp is the way to go (device -> setup -> operations). The PAN-MIB modules are available at the Technical Documentation page here at support.paloaltonetworks.com.
In PAN-COMMON-MIB.my you have stuff such as (shortened):
-- Session
panSessionUtilization OBJECT-TYPE
DESCRIPTION
"Session table utilization percentage. Values should
be between 0 and 100."
panSessionMax OBJECT-TYPE
DESCRIPTION
"Total number of sessions supported."
panSessionActive OBJECT-TYPE
DESCRIPTION
"Total number of active sessions."
panSessionActiveTcp OBJECT-TYPE
DESCRIPTION
"Total number of active TCP sessions."
panSessionActiveUdp OBJECT-TYPE
DESCRIPTION
"Total number of active UDP sessions."
panSessionActiveICMP OBJECT-TYPE
DESCRIPTION
"Total number of active ICMP sessions."
Once you have the utilization over time you can check the datasheets to select a proper hardware depending on wallet size and stuff like that 😃
- Mark as New
- Subscribe to RSS Feed
- Permalink
03-13-2012 04:32 AM
Thanks for the answer, but what i really want to know if there is any historic of the throughput, sessions and cpu usage.
I don't know if i have a PAN device connected in tap mode during 1 week and i want to know the maximum concurrent sessions, througput or cpu usage it had during this week. I could no find something like that in custom reports. Any idea?
Thanks in advance.
- Mark as New
- Subscribe to RSS Feed
- Permalink
03-13-2012 05:39 AM
You might consider using SNMP / Cacti for that, maybe not the answer you were looking for, but IMO those are ideal for this kind of monitoring. That's what I personally use.
- Mark as New
- Subscribe to RSS Feed
- Permalink
03-13-2012 03:22 PM
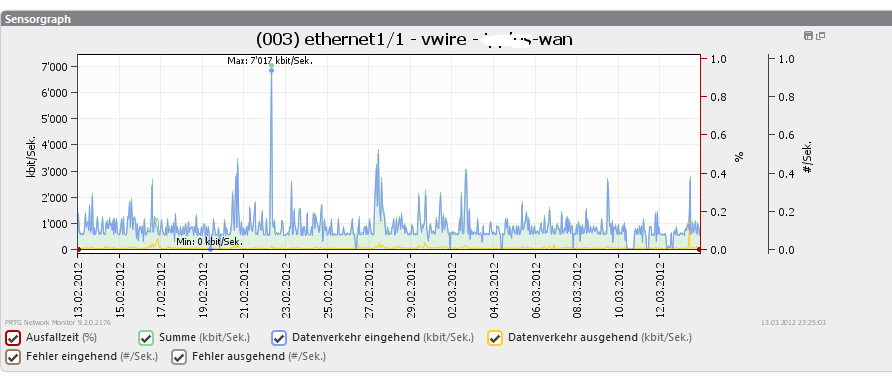
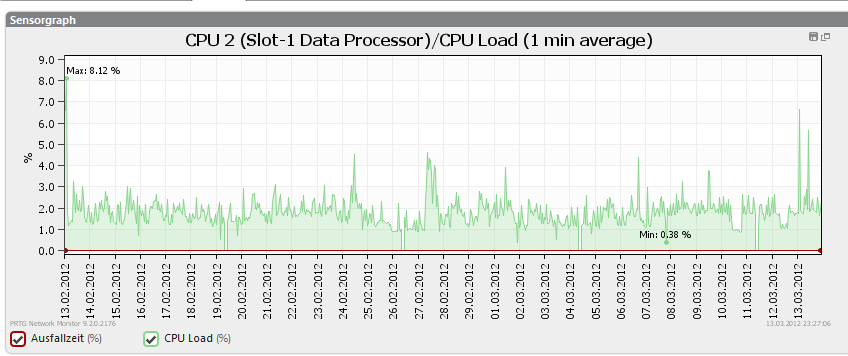
We are using PRTG for long term monitoring cpu, bandwidth, sessions etc. of our PA boxes. I can highly recommend PRTG very easy to setup and use also for netflow data exports and all kind of other stuff including xml API to talk to PA.


Roland
- 4711 Views
- 4 replies
- 0 Likes
Show your appreciation!
Click Accept as Solution to acknowledge that the answer to your question has been provided.
The button appears next to the replies on topics you’ve started. The member who gave the solution and all future visitors to this topic will appreciate it!
These simple actions take just seconds of your time, but go a long way in showing appreciation for community members and the LIVEcommunity as a whole!
The LIVEcommunity thanks you for your participation!
- Enforce GlobalProtect Access Based on Microsoft Intune Compliance Status in GlobalProtect Discussions
- Ownership Dispute Involving Palo Alto Hardware in General Topics
- Cortex XDR Pro – Does it scan USB devices upon insertion? in Cortex XDR Discussions
- USB SCANING in Cortex XDR Discussions
- IoT Devices in Panorama in Panorama Discussions


