- Access exclusive content
- Connect with peers
- Share your expertise
- Find support resources
Click Preferences to customize your cookie settings.
Unlock your full community experience!
PAN-OS 8.0 HTTP Log Integration with Slack
- LIVEcommunity
- Tools
- HTTP Log Forwarding
- Log Forwarding Articles
- PAN-OS 8.0 HTTP Log Integration with Slack
- Subscribe to RSS Feed
- Mark as New
- Mark as Read
- Printer Friendly Page
- Mark as New
- Subscribe to RSS Feed
- Permalink
on 08-17-2017 10:24 AM - edited on 10-23-2019 09:19 AM by Retired Member
PAN-OS 8.0 HTTP Log Integration with Slack
This document assumes that you have already created a Slack team. This sample integration was done with a free Slack account.
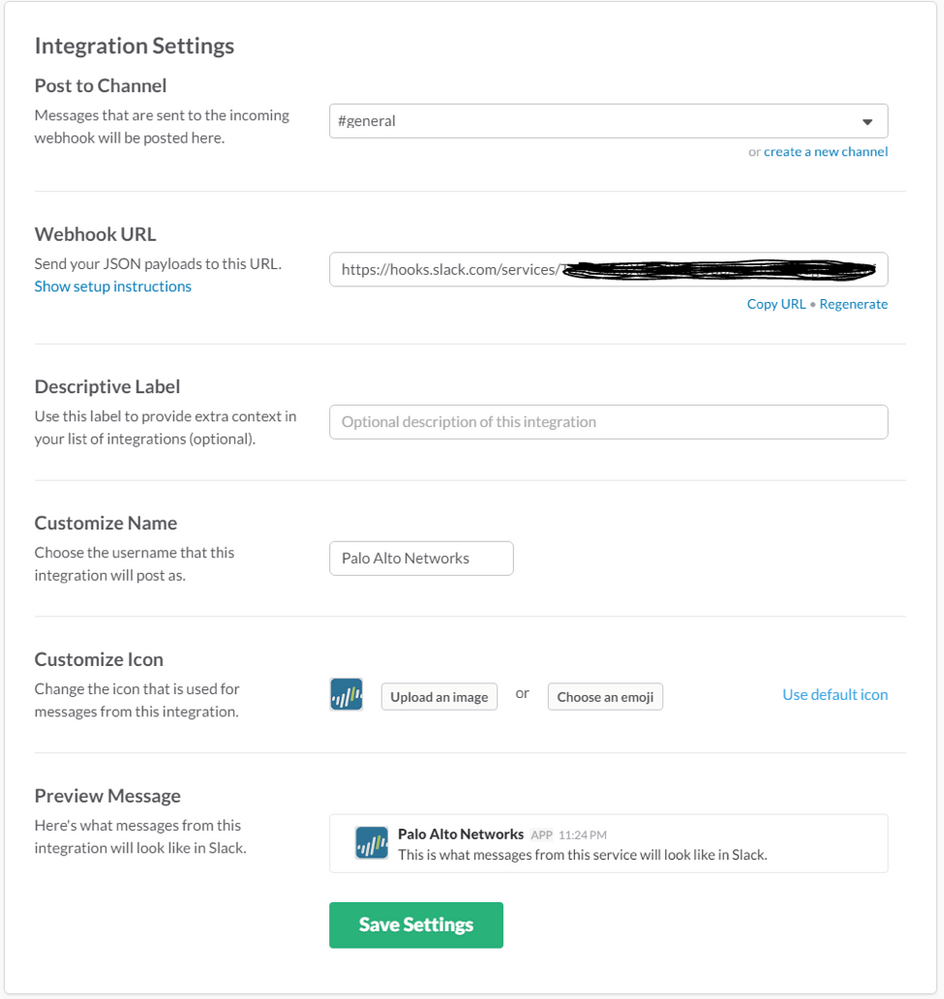
Once you have created your Slack team, login to your slack account and add an “Incoming Webhooks” custom integration on the slack website. During that configuration, you will select the channel where the message will be broadcast (#general in this example). You will also receive a Webhook URL, and an opportunity to customize the Name and Icon for the source of the message.
Here’s a screenshot of the Incoming Webhooks configuration on the slack website:
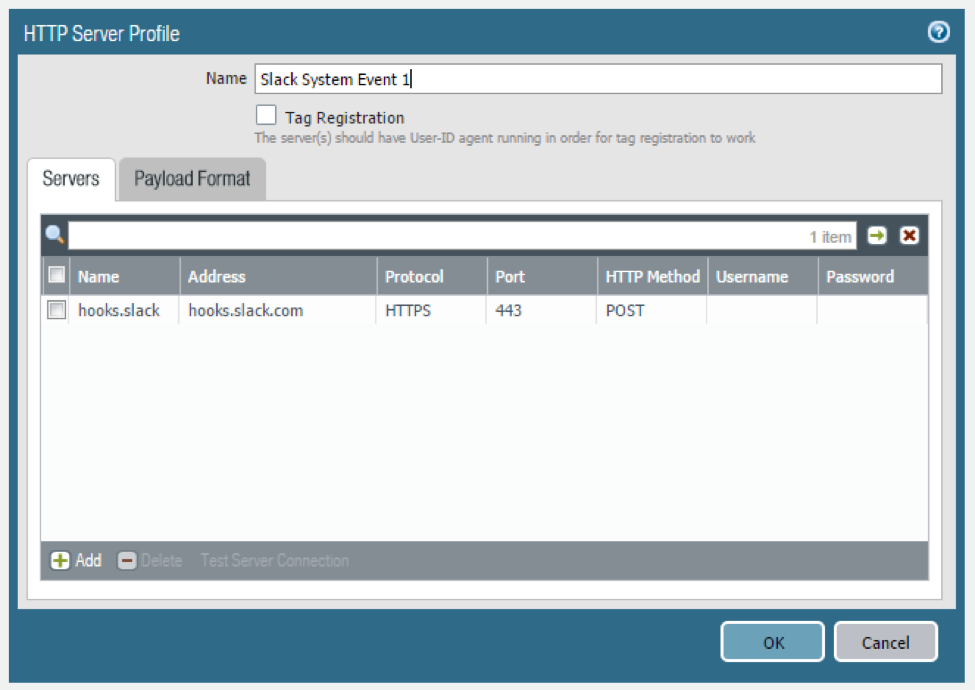
Next, configure an HTTP Server Profile in PAN-OS 8.0. Use the first part of the Webhooks URL in the “Address” field. In this example, it is “hooks.slack.com” using HTTPS on 443 with the POST HTTP method. Username/Password are not required for this particular integration.
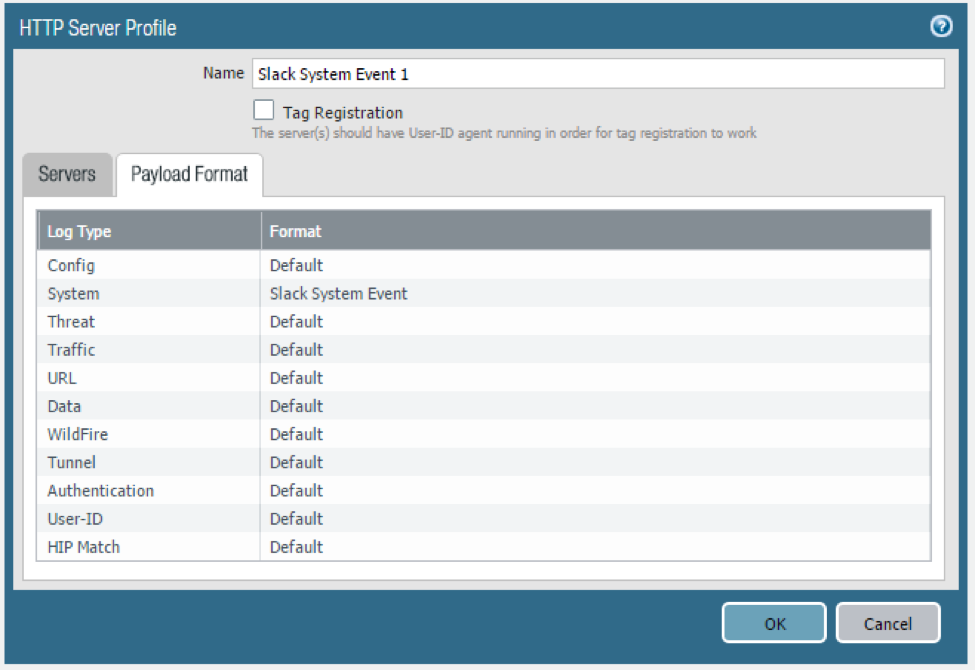
Personally, I was interested in specific “system” events, so this document focuses on the system-level logs. Similar integrations could easily be done with traffic, threat, and/or URL logs.
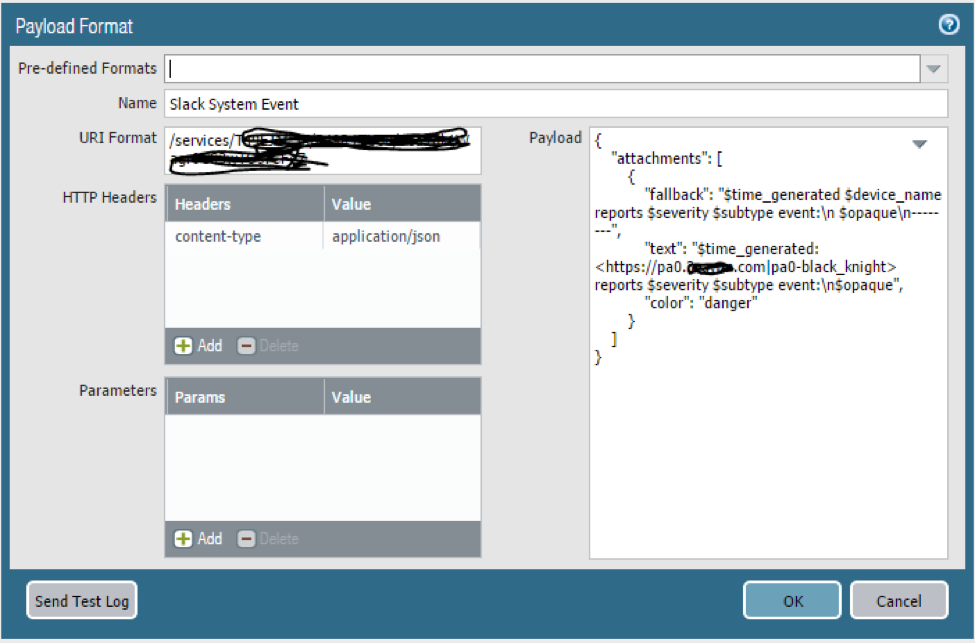
This is what the System format looks like:
In the URI Format box, provide the URI portion of the Slack-provided Incoming Webhooks URL, beginning with /service
The content-type must be application/json
Leave the Parameters field blank.
The Payload input box accepts the default Slack-preferred JSON format as documented here: https://api.slack.com/incoming-webhooks
No additional escaping is required to add the PAN-OS provided variables to the payload. In this example, I’m using a rich-formatted “attachments” message from Slack, although the basic format works perfectly as well.
Here are two samples that you should be able to cut and paste:
Rich Format Message:
{
"attachments": [
{
"fallback": "$time_generated $device_name reports $severity $subtype event:\n $opaque\n--------",
"text": "$time_generated: <https://pa0.example.com|pa0> reports $severity $subtype event:\n$opaque",
"color": "danger"
}
]
}
Simple Format Message:
{
"text": "$time_generated $device_name reports $severity $subtype event:\n $opaque\n--------"
}
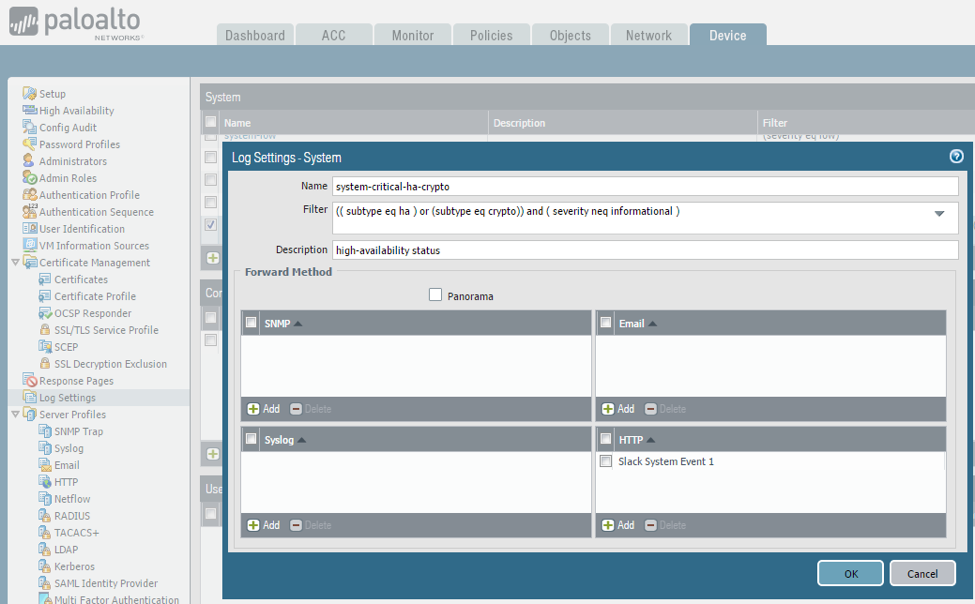
Since I was mainly interested in system-level events, I tied it all together in the Device / Log Settings tab. I haven’t narrowed-down exactly what I want to see in the slack channel, but for the purposes of this test, I wanted to see non-informational ha or crypto events, so used the following system log filter:
(( subtype eq ha ) or (subtype eq crypto)) and ( severity neq informational )
I matched that with the “Slack System Event 1” created earlier. The configuration looks like this:
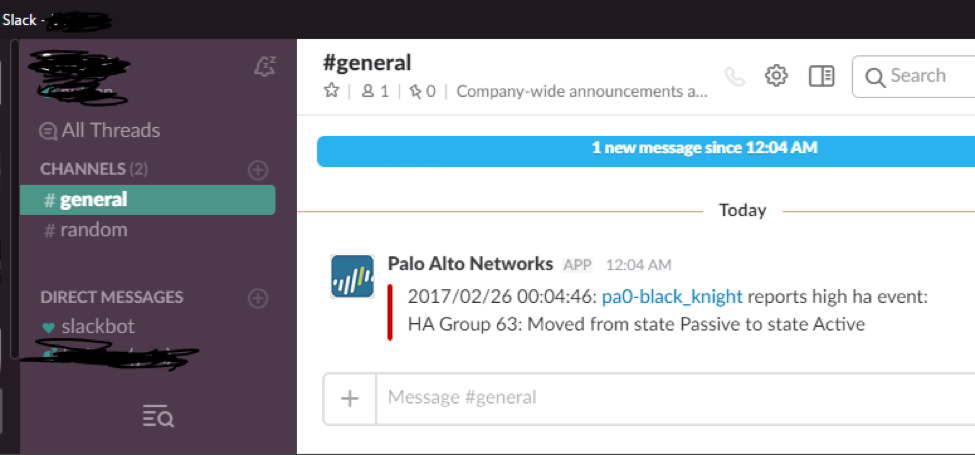
Here’s what I see on my desktop in the Slack app when I initiate a manual HA state change via the PAN-OS GUI:
Looks good on the phone too: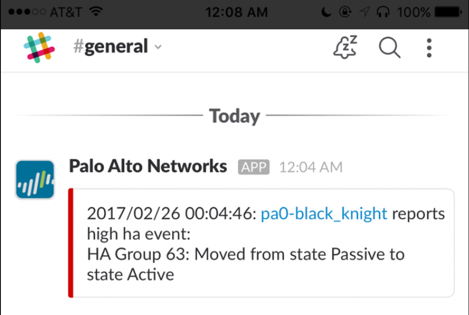
Nice articel! I just tried to follow theser steps, unfortunately my PA-200 say:
Sorry, didn't repor
@rkemburu wrote:PAN-OS 8.0 HTTP Log Integration with Slack
This document assumes that you have already created a Slack team. This sample integration was done with a free Slack account.
Once you have created your Slack team, login to your slack account and add an “Incoming Webhooks” custom integration on the slack website. During that configuration, you will select the channel where the message will be broadcast (#general in this example). You will also receive a Webhook URL, and an opportunity to customize the Name and Icon for the source of the message.
Here’s a screenshot of the Incoming Webhooks configuration on the slack website:
Next, configure an HTTP Server Profile in PAN-OS 8.0. Use the first part of the Webhooks URL in the “Address” field. In this example, it is “hooks.slack.com” using HTTPS on 443 with the POST HTTP method. Username/Password are not required for this particular integration.
Personally, I was interested in specific “system” events, so this document focuses on the system-level logs. Similar integrations could easily be done with traffic, threat, and/or URL logs.
This is what the System format looks like:
In the URI Format box, provide the URI portion of the Slack-provided Incoming Webhooks URL, beginning with /service
The content-type must be application/json
Leave the Parameters field blank.
The Payload input box accepts the default Slack-preferred JSON format as documented here: https://api.slack.com/incoming-webhooks
No additional escaping is required to add the PAN-OS provided variables to the payload. In this example, I’m using a rich-formatted “attachments” message from Slack, although the basic format works perfectly as well.
Here are two samples that you should be able to cut&paste:
Rich Format Message:
{
"attachments": [
{
"fallback": "$time_generated $device_name reports $severity $subtype event:\n $opaque\n--------",
"text": "$time_generated: <https://pa0.example.com|pa0> reports $severity $subtype event:\n$opaque",
"color": "danger"
}
]
}
Simple Format Message:
{
"text": "$time_generated $device_name reports $severity $subtype event:\n $opaque\n--------"
}
Since I was mainly interested in system-level events, I tied it all together in the Device / Log Settings tab. I haven’t narrowed-down exactly what I want to see in the slack channel, but for the purposes of this test, I wanted to see non-informational ha or crypto events, so used the following system log filter:
(( subtype eq ha ) or (subtype eq crypto)) and ( severity neq informational )
I matched that with the “Slack System Event 1” created earlier. The configuration looks like this:
Here’s what I see on my desktop in the Slack app when I initiate a manual HA state change via the PAN-OS GUI:
Looks good on the phone too:
Created by Jared Valentine - Systems Engineer
t back - It does work just fine. As far as I remember I suffered from a cert issue. Regards, Walter
What kind of certs do you need on the Firewall in order to do this slack integration?
For some reason i am confiruing everything correctly but it does not like using this
$opaque\n if i remove it and test test by sending log to slack it works any ideas?
I have successfully deployed this awesome feature into my 70 firewalls using Panorama.
The alerts are flowing into my designated slack channel, however, I am not getting very intuitive information from some devices.
For example when an alert flows to my channel the notification Windows gives me show the entirety of the Palo Alto firewall name. When I look at the actual data within the channel I am not seeing the same data present on certain devcies.
Compared to:
Any help is appreciated.
Hi @EddieBrown ,
i came across the same issue. Some information are missing on slack...
Did you manage to find the problem?
I am forwarding this to the features owners to take a look.
Glad you like the feature.
Do you use any other integrations as well? How did you hear about the feature?
@Jamiefitzgerald That is a lot of questions. I would like the feature more if it worked as advertised.
I use a few other integrations: PingID, MineMeld. I heard about this feature via a Slack/Palo Alto google search.
@Jamiefitzgerald Any update on why we are only seeing half the information in Slack?
Hello,
Nice solution and thank you very much for taking the time to think about this solution.
Unfortunately, the firewalls are in a secure environment and do not have access to the Internet
Logs are sent to Splunk and Tufin servers which are on the same secure environment.
however, if it were necessary to create a server in this secure environment which allows to recover this type of alerts, it would be possible.
Thanks to all of you in advance
Valentino
- 59235 Views
- 15 comments
- 10 Likes
-
Automation
1 -
HTTP
2 -
ifttt
1 -
Log Forwarding
4 -
NGFW Configuration
1 -
notifications
1 -
PAN-OS
2 -
Panorama Configuration
1 -
slack
1 -
twilio
1


