- Access exclusive content
- Connect with peers
- Share your expertise
- Find support resources
Click Preferences to customize your cookie settings.
Unlock your full community experience!
Cortex XDR Alerts
- LIVEcommunity
- Discussions
- Security Operations
- Cortex XDR Discussions
- Cortex XDR Alerts
- Subscribe to RSS Feed
- Mark Topic as New
- Mark Topic as Read
- Float this Topic for Current User
- Printer Friendly Page
- Mark as New
- Subscribe to RSS Feed
- Permalink
04-21-2020 08:04 AM
Hi,
I can't seem to find what I'm looking for in the Cortex XDR console. I am trying to find a way to view all alerts generated whether it is from XDR or Analytics. The only way I can see this list is if I create an exclusion Investigation --> Exclusions --> Add Exclusion. Is there a more direct way to view these Alerts?
Thanks
Accepted Solutions
- Mark as New
- Subscribe to RSS Feed
- Permalink
04-21-2020 09:23 AM
HI there-
Go to Investigation > Incidents - then click on Alerts Table over to the right of the screen.
David Falcon
Senior Solutions Architect, Cortex
Palo Alto Networks®
- Mark as New
- Subscribe to RSS Feed
- Permalink
04-21-2020 09:23 AM
HI there-
Go to Investigation > Incidents - then click on Alerts Table over to the right of the screen.
David Falcon
Senior Solutions Architect, Cortex
Palo Alto Networks®
- Mark as New
- Subscribe to RSS Feed
- Permalink
04-21-2020 10:38 AM
Thank you @dfalcon!
Feels like it is hidden away. They should be making this a submenu directly off of the Investigation menu.
- Mark as New
- Subscribe to RSS Feed
- Permalink
04-21-2020 10:45 AM
I will share that feedback with the Product Team.
David Falcon
Senior Solutions Architect, Cortex
Palo Alto Networks®
- Mark as New
- Subscribe to RSS Feed
- Permalink
09-19-2022 01:44 PM
I too was having the same problem... wanting to look at the Alerts and how those turn into Incidents. I think it would be great to have a dashboard widget that would present a bar graph that shows the volume of Low, Medium, High and Critical alerts. Thanks.
- Mark as New
- Subscribe to RSS Feed
- Permalink
09-20-2022 05:41 AM
Hi!
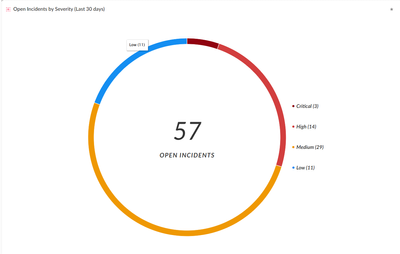
While incident/alert information is not currently accessible via XQL, we do offer a few OOTB widgets which could be similar to what you're looking to create.
If you'd go into your XDR tenant -> Dashboards & Reports -> Widget Library and type 'severity' in the search bar you should be able to find the 'Open Incidents By Severity' widget (screenshot attached below).
Let me know if you have any further questions.
- Mark as New
- Subscribe to RSS Feed
- Permalink
09-20-2022 09:08 AM
Is it possible to allow us to add the ALERT TABLE as a favorite button? That way I can get into it with a single button, verses having to go into via the Incident screen?
Thank you,
Chris Smith
- Mark as New
- Subscribe to RSS Feed
- Permalink
11-15-2022 10:24 AM
Had this issue today. I said the same thing when I found Alerts Table: "why isn't this an option indented under Incidents"
You can keep it where it is but add the direct link as well
- Mark as New
- Subscribe to RSS Feed
- Permalink
12-09-2022 08:19 AM
Hey @NPTEChrisSmith and @Optimizer ,
I believe Alert Table is not in the navigation bar, because Palo wants you to steer your focus on more important Incidents.
Cortex XDR console will generate Incident for each alert with severity Medium, High and Critical. It will generate incident some Low severity alert, but not all of them.
Incidents are simple containers, which will consolidate/aggregate all alert that are somehow related.
So it should be more easy to focus on the Incidents and not overwhelm by avalanche of alerts
Now that being said there are two easy way to navigate to Alert table without jumping around:
- The easiest way would be to open URL https://<your-xdr-address>/alerts You can bookmark this URL and just click on your bookmark after you authenticate (if open the link after authentication, you will be redirected to the dashboard)
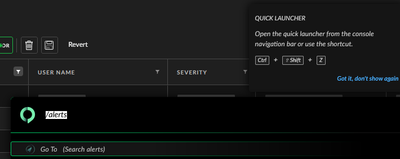
- You can use the quick launcher and its "go to" search. Type "/alert" - / to enter go to search and "alert" for the string you want to search. You will see the results below, navigate with arrows and enter to select
- 1 accepted solution
- 12276 Views
- 8 replies
- 0 Likes
Show your appreciation!
Click Accept as Solution to acknowledge that the answer to your question has been provided.
The button appears next to the replies on topics you’ve started. The member who gave the solution and all future visitors to this topic will appreciate it!
These simple actions take just seconds of your time, but go a long way in showing appreciation for community members and the LIVEcommunity as a whole!
The LIVEcommunity thanks you for your participation!
- Is there an API to add IPs to Cortex XDR EDL programmatically? in Cortex XDR Discussions
- Cortex XDR Pro – Does it scan USB devices upon insertion? in Cortex XDR Discussions
- Application Fingerprinting in Cortex XDR Discussions
- MacOS uninstall password reset in Cortex XDR Discussions
- Es posible bloquear una IP en cortex xdr pro in Cortex XDR Discussions


