- Access exclusive content
- Connect with peers
- Share your expertise
- Find support resources
Click Preferences to customize your cookie settings.
Unlock your full community experience!
Issues configuring M. Learning while using Panorama for traffic analysis
- LIVEcommunity
- Tools
- Expedition
- Expedition Discussions
- Re: Issues configuring M. Learning while using Panorama for traffic analysis
- Subscribe to RSS Feed
- Mark Topic as New
- Mark Topic as Read
- Float this Topic for Current User
- Printer Friendly Page
Issues configuring M. Learning while using Panorama for traffic analysis
- Mark as New
- Subscribe to RSS Feed
- Permalink
03-15-2020 12:10 PM - edited 03-15-2020 12:13 PM
Hello,
I'm trying to configure M. Learning in Expedition so that we can analyze the traffic passing through specific any any rules.
We use Panorama to manage the security policy on each of the individual firewalls. Is this an issue when trying to use Machine Learning? Here is the issue I'm running into.
I've setup Scheduled Log Exports on each of the individual firewalls to export their logs to Expedition.
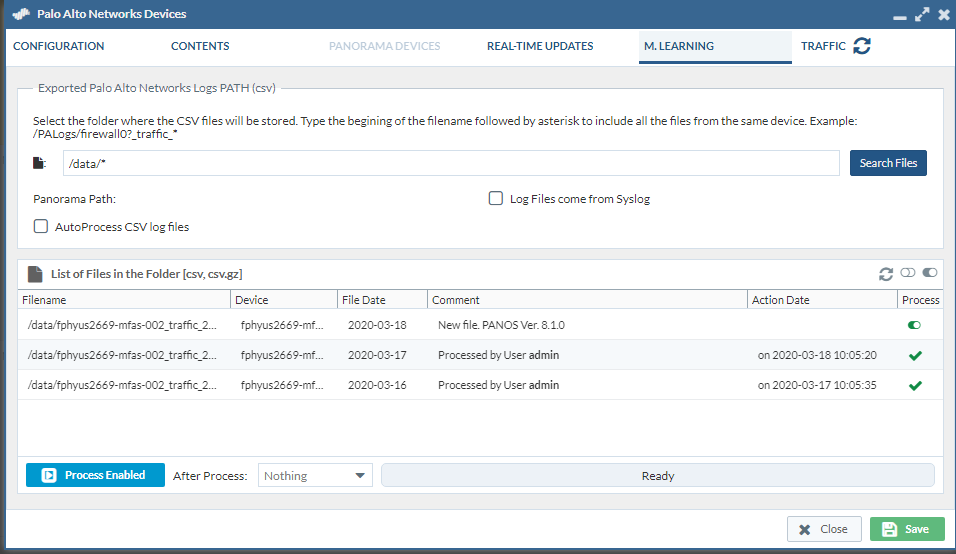
In Expedition if I add the individual firewall in the Devices tab I can see the csv file and process it in its M.Learning tab. But if I create a project with that firewall I cannot see any of the policy to do a traffic analysis or much of anything else. My assumption is because all that information is being managed at the Panorama level.
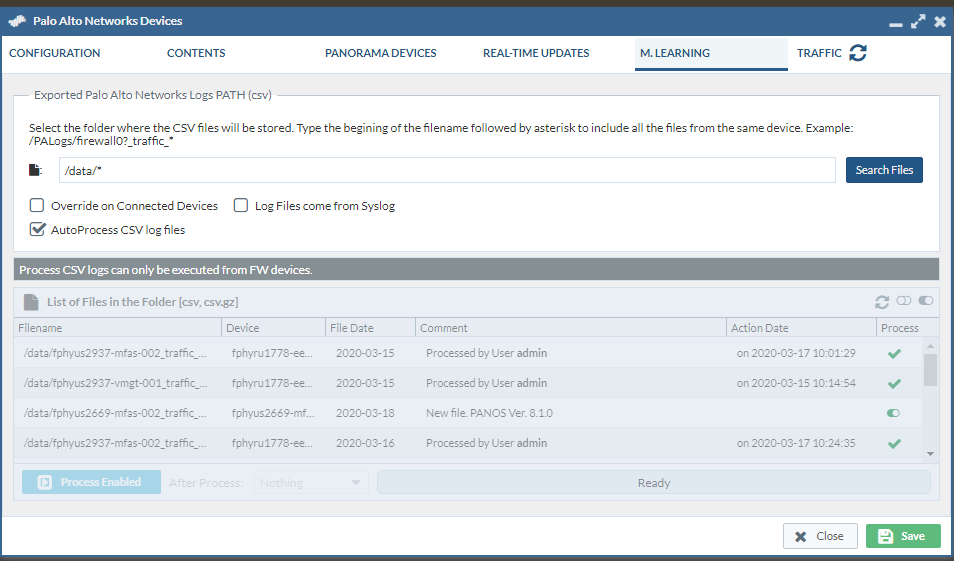
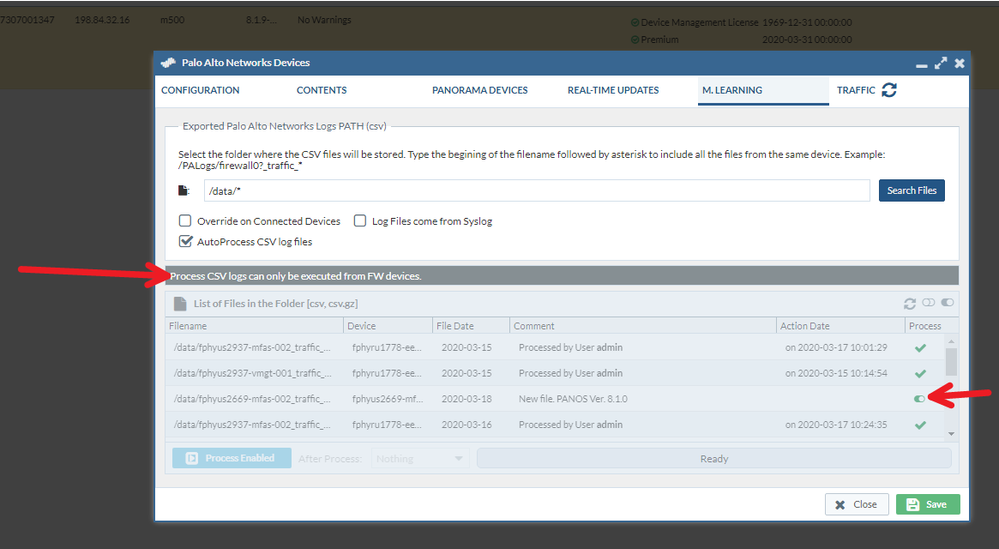
However. If I add the panorama in the Devices tab and retrieve the specific firewall device and retrieve its configuration, I cannot then process the exported log in the M. Learning tab. I see the files but everything is grayed out and it has a header that says "Process CSV logs can only be executed from FW devices." But when I add the Panorama to a project I can see the entire security policy and everything else.
Does ML only work in environments where the firewalls aren't centrally managed by Panorama?
- Mark as New
- Subscribe to RSS Feed
- Permalink
03-15-2020 12:24 PM
Hello BOkay,
ML works for your environment, you will process logs by going to firewall , when you want to analyze the rules , you will retrieve config from panorama since all your security policy is in panorama, so you will add panorama in your project , import config, next you will need to add panorama as log connector by going to plugin. After all that , you can then go to security policy and select The device group where the rules located then right click Machine Learning , add the selected rule to Machine learning , then click on the machine learning green tab in the bottom to start machine learning.
- Mark as New
- Subscribe to RSS Feed
- Permalink
03-15-2020 02:17 PM
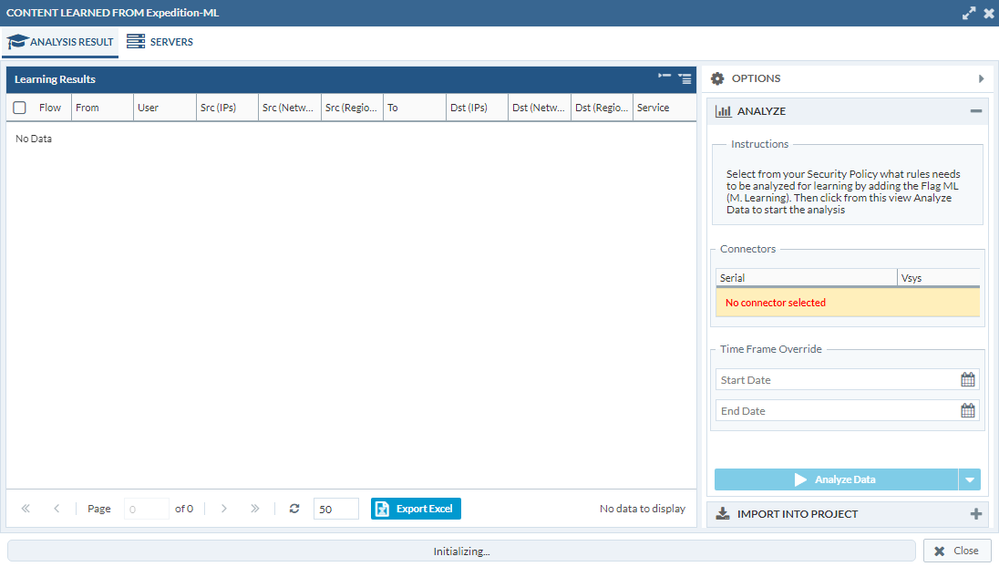
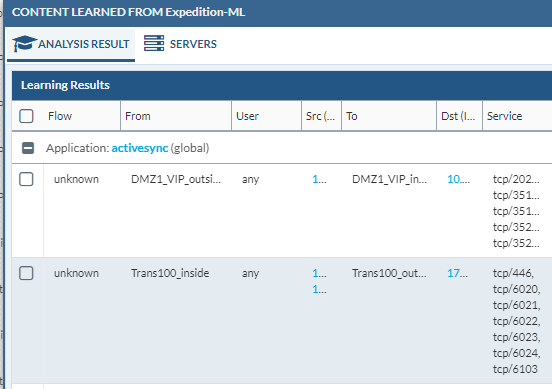
By green button I'm assuming you mean "Discovery". Then I click Machine Learning. What am I supposed to do after that? Nothing is listed and if I click Analyze Data it appears to get stuck on Initializing and crashes Expedition. Also is "No connector selected" in the picture below normal?
- Mark as New
- Subscribe to RSS Feed
- Permalink
03-15-2020 03:03 PM
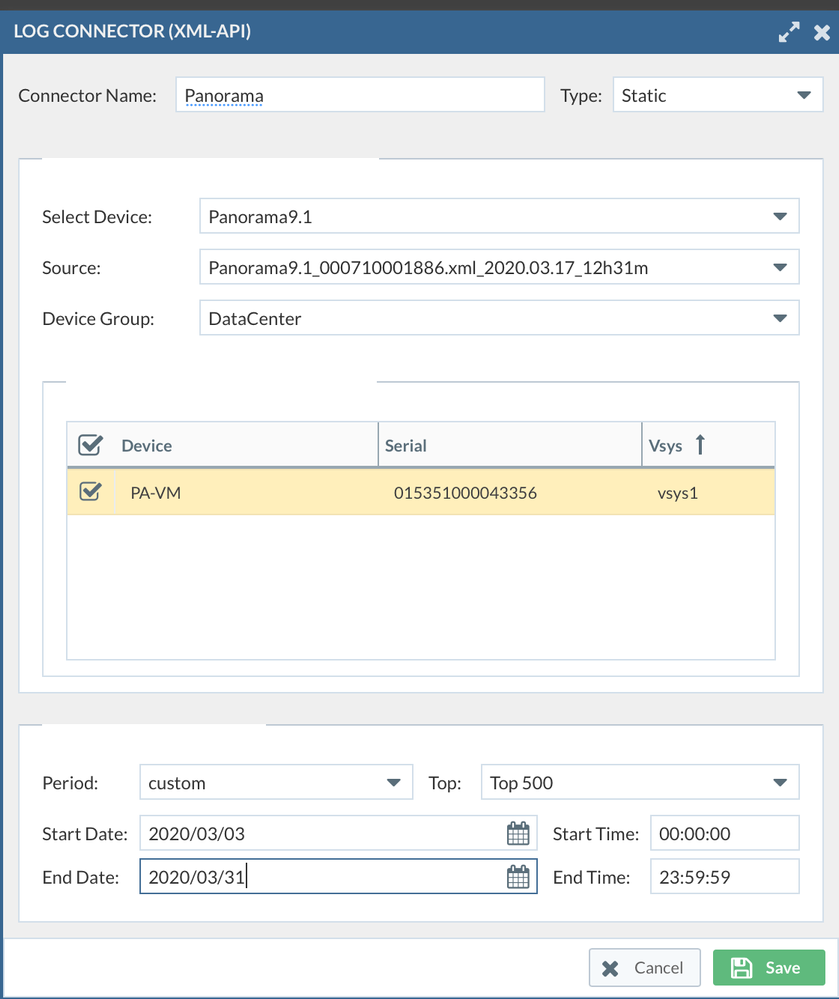
It seems like it did not see any log connector ,when you add log connector under plug in. , you will need to select the corresponding device group.
- Mark as New
- Subscribe to RSS Feed
- Permalink
03-15-2020 04:19 PM
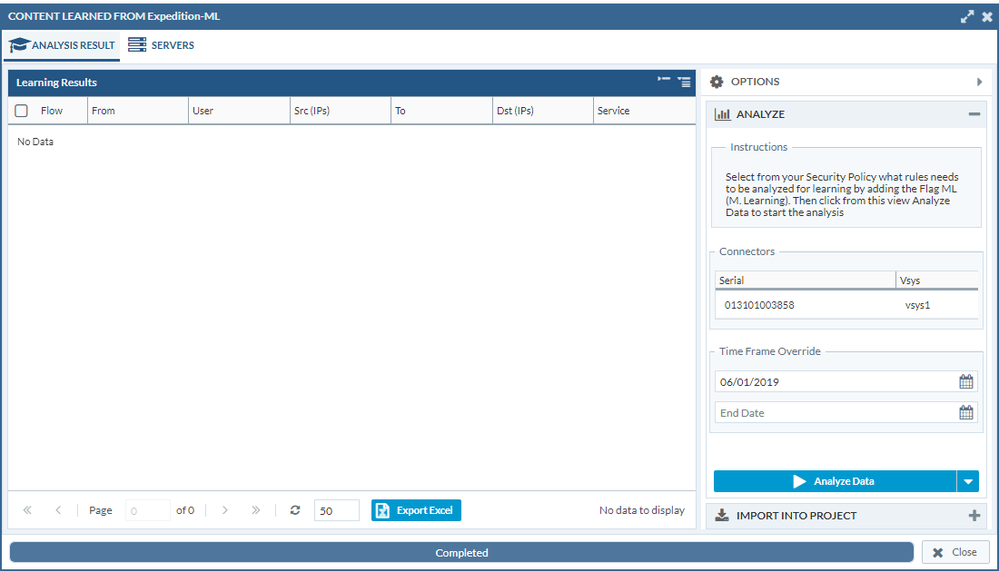
Ah I didn't realize you had to pick a active log connector as I had several. I picked the right one and it ran but has No Data even though I know there is traffic data available via Panorama.
- Mark as New
- Subscribe to RSS Feed
- Permalink
03-15-2020 05:01 PM
Look like from your screenshot you select timeframe was June 2019 , you will make sure the time field of the traffic log you export from firewall to expedition matching the time you specify in the log connector .
- Mark as New
- Subscribe to RSS Feed
- Permalink
03-15-2020 05:39 PM
It's the same as my log connector. I was just making sure I went back far so that I could get as many logs as possible. You said, "traffic log you export from firewall", however. Did I miss that step? I didn't do any exports, I was under the impression the log connector was all I needed when using panorama. I scheduled the log export to the individual firewalls but that didn't work when using Panorama.
- Mark as New
- Subscribe to RSS Feed
- Permalink
03-15-2020 06:34 PM
You could follow the steps in this doc https://live.paloaltonetworks.com/twzvq79624/attachments/twzvq79624/ExpeditionArticles/157/1/Expedit...
- Mark as New
- Subscribe to RSS Feed
- Permalink
03-17-2020 11:24 AM
I followed that document and it puts me in my original situation.
If I use the individual firewall I have the ability to process the scheduled log exports that are sent to Expedition. But when you start a project and go into the policy the policy is empty.
If I use panorama I lose the ability to process the scheduled log exports as it is all grayed out for the individual firewall. But when I start a project I do have the policy but no mater what log connector I use no rules show up when I click Discovery.
I've followed the following guides with no luck.
Expedition Migration and Security Assessment Quick Start 1.1.0
Expedition New Feature: Scheduled Log Processing 1.1.21
- Mark as New
- Subscribe to RSS Feed
- Permalink
03-17-2020 12:38 PM
Hi BOkay,
Please verify below :
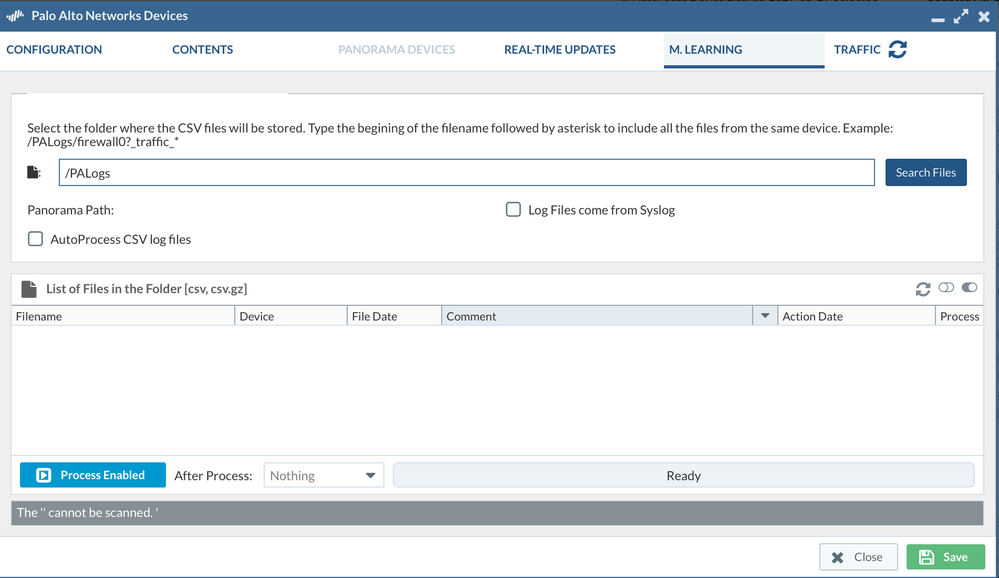
1. Make sure firewall logs you want to process is located at the path you specified in the M Learning setting, example, here we use /PALogs
2. Once you see the files show up in the folder, you will click on Process to process the firewall logs first.
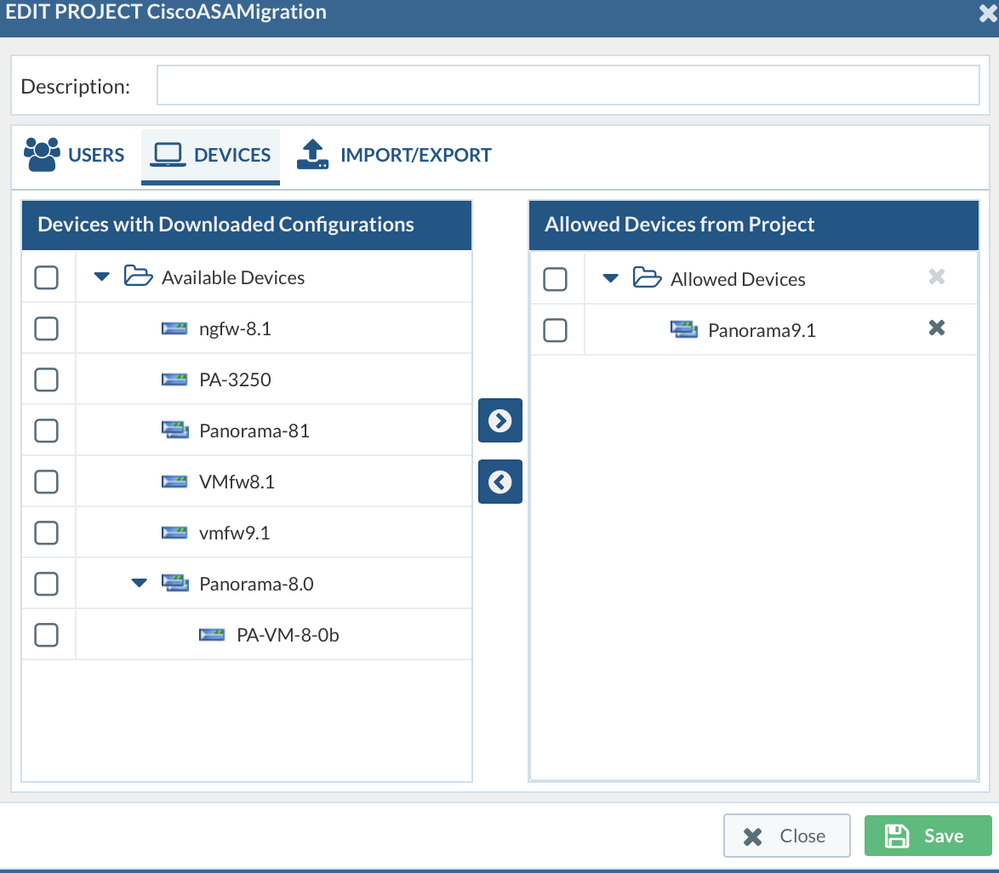
3. After all the logs are processed then you will create a new project, and add panorama in the settings of the project like below:
4. Go into project, go to plugin , add panorama as log connector , make sure you select the corresponding device group and the firewalls that you processed the logs in step 1, select the timeframe for you traffic logs
5. Then goin to policy , continue the ML steps as mentioned in the ML doc.
If you still need assistance, please write e-mail to fwmigrate@paloaltonetworks.com
Thanks!
- Mark as New
- Subscribe to RSS Feed
- Permalink
03-19-2020 02:01 AM
If you desire to use ML or RE, we do need to have logs in Expedition.
ML and RE do a data analytics process on the traffic logs that can't be performed on Panorama or FWs, as they are much more complex than generating reports on the devices.
Therefore, we need to export the traffic logs into Expedition so we can perform the analysis.
The steps that Lynn showed are required to execute ML or RE. Also, it is very important that the configuration you bring into your project comes from a Device you have declared in Expedition, and not by directly providing an XML to the project. This is necessary because this way we can know the relationship between the security rules you want to analyze (that are declared in a device config) and the traffic logs that the device has provided.
Notice that the "device" is the link between traffic logs and security rules, therefore we need to import the configuration from the Device
- Mark as New
- Subscribe to RSS Feed
- Permalink
03-19-2020 07:39 AM
The problem appears to lie in the dynamic between using individual firewalls & panorama.
You can only do HALF of the workflows depending on if you import individual firewalls vs panorama.
You can ONLY do the first half of the workflow if you import individual firewalls.
You can ONLY do the second half of the workflow if you import panorama.
But you cannot do it ALL using either method. Meaning you would have to break everything down daily as you get new logs.
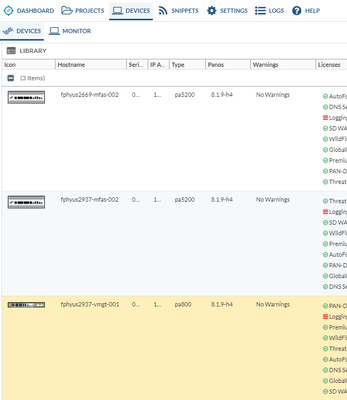
In the device tab. If you import just the individual firewalls...
You can do the following:
- Go into the individual firewall's M.Learning tab and the Process table is ENABLED.
- You can process the CSV logs.
You can NOT do the following:
- You can NOT see any of the security policy once a project is created using the individual firewalls. This means you cannot do M. Learning traffic analysis.
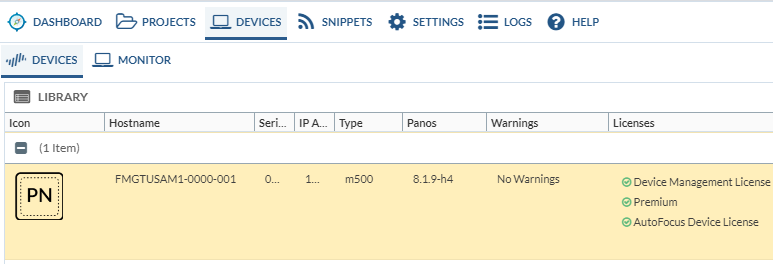
Now if you import Panorama In the device tab
Importing Panorama *absorbs* those individual firewalls. As you can see, the individual firewalls are gone and only panorama remains in the device tab.
Now things are reversed.
You can NOT do the following:
- Go into the individual firewall's M.Learning tab and the Process table is DISABLED and grayed out.
- You can no longer process the CSV logs. This means we can no longer process new csv logs that will come in.
You can do the following:
- Now when you create a project you can now see the security policy, mark rules for M. Learning, and analyze that traffic.
This obviously is not a workflow that is practical. If I were to need to do traffic analysis daily I would basically have to break everything down and re-implement everything again. I'd have to do the following daily.
- Delete Panorama from the device tab. (because I can no longer process new csv logs)
- Add each individual firewall to the device tab.
- Do the first half of the workflow. (now I can process new csv logs)
- Add Panorama (now those individual firewalls are gone and are absorbed into panorama taking away the ability to process new csv logs)
- Do the second half of the workflow.
Now unless there is still something wrong with the way I'm implementing this I think there is a bug. The problem really lies in the disabling of the ability to process CSV Logs to individual firewalls when you are using Panorama.
If "Process CSV logs can only be executed from FW devices." and the grayed out CSV logs were to be removed when using Panorama it should solve everything.
- Mark as New
- Subscribe to RSS Feed
- Permalink
03-19-2020 08:05 AM
From the Panorama device, you can provide a Path for all the firewalls managed by that Panorama.
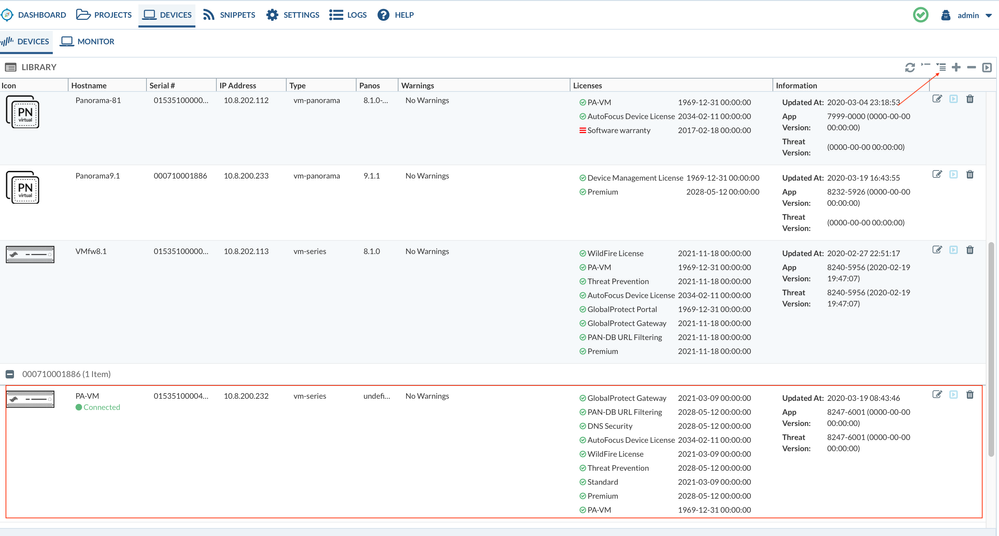
If you select to see all the Firewalls, not only the directly connected devices (do it clicking on the three lines icon on the Devices view) you would see all the Firewalls, and you can even select and Autooprocess on the logs, so you do not need to get into them daily.
Later on, in your project, you can import the Panorama config and define in your log connector the Device Group and the devices within that DG for the ML and RE.
- Mark as New
- Subscribe to RSS Feed
- Permalink
03-19-2020 08:25 AM
Can you provide a screenshot of what you are referring to? I'm not following.
- Mark as New
- Subscribe to RSS Feed
- Permalink
03-19-2020 08:54 AM - edited 03-19-2020 09:06 AM
BOkay,
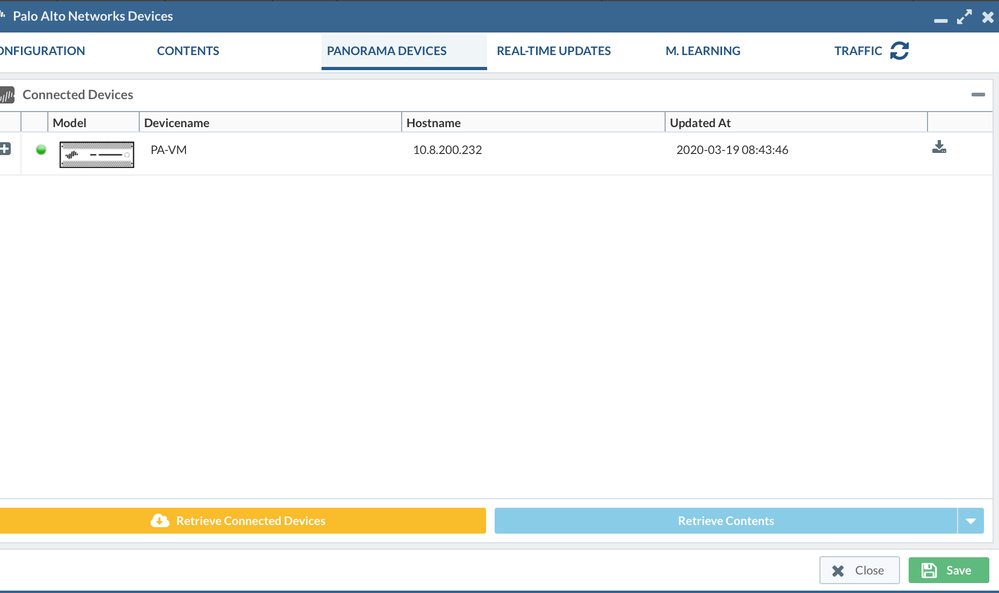
Instead of add firewall directly to devices, can you only add Panorama as devices, and go to Panorama Device , Click on orange button "Retrieve Connected Devices "
When you want to process logs , you will then click on the icon on the right upper corner to "show all devices" , and you should see your firewalls , then goin to the firewall to process the ML logs.
So you do not need to add firewall directly to the devices, just add panorama and retrieved the connected devices, then process the logs in the connected firewall that you got those logs from, make sure the traffic log matched the serial# of the firewall.
After ML log is processed then you can add a new project and continue the steps I mentioned in the previous post.
- 18375 Views
- 18 replies
- 0 Likes
Show your appreciation!
Click Accept as Solution to acknowledge that the answer to your question has been provided.
The button appears next to the replies on topics you’ve started. The member who gave the solution and all future visitors to this topic will appreciate it!
These simple actions take just seconds of your time, but go a long way in showing appreciation for community members and the LIVEcommunity as a whole!
The LIVEcommunity thanks you for your participation!
- Machine Learning Analysis is empty in Expedition Discussions
- M.Learning Analysis results empty in Expedition Discussions
- Cisco ASA To Panorama Partial Configuration question in Expedition Discussions
- Import PAN managed by Panorama not showing Policy and other data in Expedition Discussions
- Expeditions stopped accepting Syslog in Expedition Discussions


