- Access exclusive content
- Connect with peers
- Share your expertise
- Find support resources
Click Preferences to customize your cookie settings.
Unlock your full community experience!
CPS calculation per server
- LIVEcommunity
- Discussions
- General Topics
- Re: CPS calculation per server
- Subscribe to RSS Feed
- Mark Topic as New
- Mark Topic as Read
- Float this Topic for Current User
- Printer Friendly Page
CPS calculation per server
- Mark as New
- Subscribe to RSS Feed
- Permalink
11-30-2020 10:01 AM
- Mark as New
- Subscribe to RSS Feed
- Permalink
11-30-2020 04:13 PM
If all of your session traffic is logged you can get a rough idea of what your traffic stats are for a given host or just in general. I would recommend just filtering the session info for a given server and scripting an automated pull of the information on a regular basis to form a longer average. Netflow or a PCAP is always going to be the most accurate method of determine traffic stats tough.
Keep in mind that you can always use the 'alert' value and adjust from there to narrow in on what your activate and maximum values actually need to be.
- Mark as New
- Subscribe to RSS Feed
- Permalink
11-30-2020 08:58 PM
Guys, so this is a question I've had for quite a while. Like what's the best way to get connection per second counts? What should the settings on scan protection be? Why do the firewalls not always identify known scans?
I've actually worked for Palo Alto for some time and was never able to get good answers to this. Can any one of you help me out, as it's becoming really relevant to me now? Thanks
- Mark as New
- Subscribe to RSS Feed
- Permalink
12-01-2020 12:36 AM - edited 12-01-2020 10:21 PM
Thanks for the information.. . . tell pizza hut
- Mark as New
- Subscribe to RSS Feed
- Permalink
12-01-2020 07:18 AM
@BPry I have setup netflow with PRTG but not sure what I am looking for in here that can give me the numbers to use for in the DoS profile.
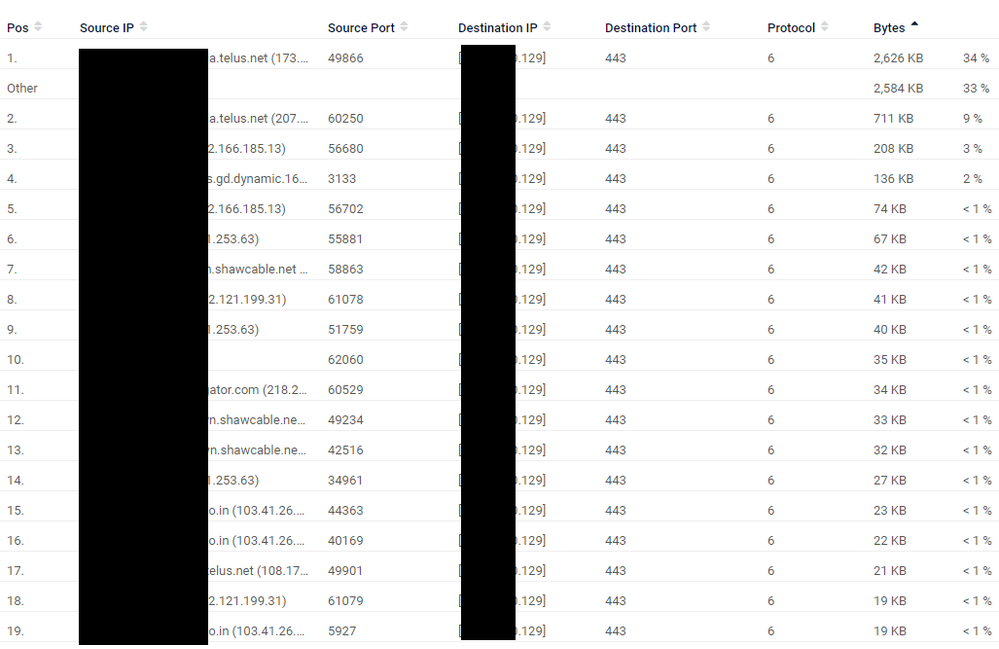
Screenshot from Top Connections
Also I can script it as well but what do I do with this. Do I count the number of sessions to the server at regular interval for this output.
show session all filter destination X.X.X.129
--------------------------------------------------------------------------------
ID Application State Type Flag Src[Sport]/Zone/Proto (translated IP[Port])
Vsys Dst[Dport]/Zone (translated IP[Port])
--------------------------------------------------------------------------------
1368583 ssl ACTIVE FLOW ND 113.173.225.13[51541]/EXTERNAL/6 (113.173.225.13[51541])
vsys1 X.X.X.129[443]/DMZN (192.168.8.30[443])
140406 ssl ACTIVE FLOW ND 209.121.37.106[52465]/EXTERNAL/6 (209.121.37.106[52465])
vsys1 X.X.X.129[443]/DMZN (192.168.8.30[443])
1381933 ssl ACTIVE FLOW ND 96.48.142.40[60647]/EXTERNAL/6 (96.48.142.40[60647])
vsys1 X.X.X.129[443]/DMZN (192.168.8.30[443])
1594610 ssl ACTIVE FLOW ND 50.98.173.15[61753]/EXTERNAL/6 (50.98.173.15[61753])
vsys1 X.X.X.129[443]/DMZN (192.168.8.30[443])
3862404 ssl ACTIVE FLOW ND 50.68.197.84[55053]/EXTERNAL/6 (50.68.197.84[55053])
- Mark as New
- Subscribe to RSS Feed
- Permalink
12-02-2020 08:59 AM
So I found this(https://github.com/zepryspet/GoPAN) to pull zone based CPS stats using snmp and I was also able to map this SNMP in PRTG as well.
But pulling data using GoPan gave more data than PRTG as poll interval is much faster for GoPan. I have to manually sort data though
I still don't get how netflow is usefull, all I see is bandwidth for HTTPS on filtering for the particular server.
@BPry or someone else can suggest what i should be doing for sever CPS calculation
- Mark as New
- Subscribe to RSS Feed
- Permalink
09-09-2021 07:20 PM
Panorama has a CPS monitor built in- but that monitors CPS for the entire firewall not for the zone in question.
- 6341 Views
- 6 replies
- 0 Likes
Show your appreciation!
Click Accept as Solution to acknowledge that the answer to your question has been provided.
The button appears next to the replies on topics you’ve started. The member who gave the solution and all future visitors to this topic will appreciate it!
These simple actions take just seconds of your time, but go a long way in showing appreciation for community members and the LIVEcommunity as a whole!
The LIVEcommunity thanks you for your participation!
- Es posible bloquear una IP en cortex xdr pro in Cortex XDR Discussions
- HealthCheckServerConfiguration fails with TypeError on XSOAR Cloud v8.13.0 in Cortex XSOAR Discussions
- return traffic being dropped, not being sent through the vpn tunnel in General Topics
- Failed to add authkey / Failed to update DB on Panorama 12.1.6 in Panorama Discussions
- Intelligence Stream 504 Error, PCC v.33 in Prisma Cloud Discussions


