- Access exclusive content
- Connect with peers
- Share your expertise
- Find support resources
Click Preferences to customize your cookie settings.
Unlock your full community experience!
Network Throughput Graphs are incoherent in PA-220
- LIVEcommunity
- Discussions
- General Topics
- Network Throughput Graphs are incoherent in PA-220
- Subscribe to RSS Feed
- Mark Topic as New
- Mark Topic as Read
- Float this Topic for Current User
- Printer Friendly Page
- Mark as New
- Subscribe to RSS Feed
- Permalink
02-23-2023 02:38 AM
Hi,
We are experiencing an issue with the PA-220 network graphs displayed in one of our sites.
We know that the router in front of the firewall delivers a 90 Mbps (Megabit per second) max throughput. This measure has been verified extensively.
However when trying to visualize the traffic received by our test machine from the firewall web GUI, we notice some extremely high values in the hundreds of MegaBytes.
This test machine is connected to the PA through a single NIC card, and the test consisted in a standard online bandwith test service.
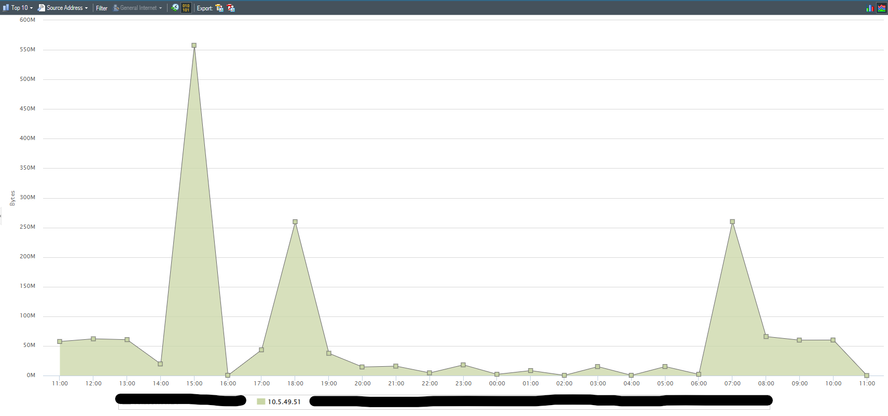
For instance at 15:00, according to the graph below our machine would have received roughly 550 MBytes of data in 1 second ? That's just impossible ...
How am I supposed to read this graph and could there be an issue with the scale ?
This is the Network Monitor graph for the test machine : ( TBN that we get similar values when using the Ingress/Egress Interface Widget Graph from the ACC and filter using the same IP)
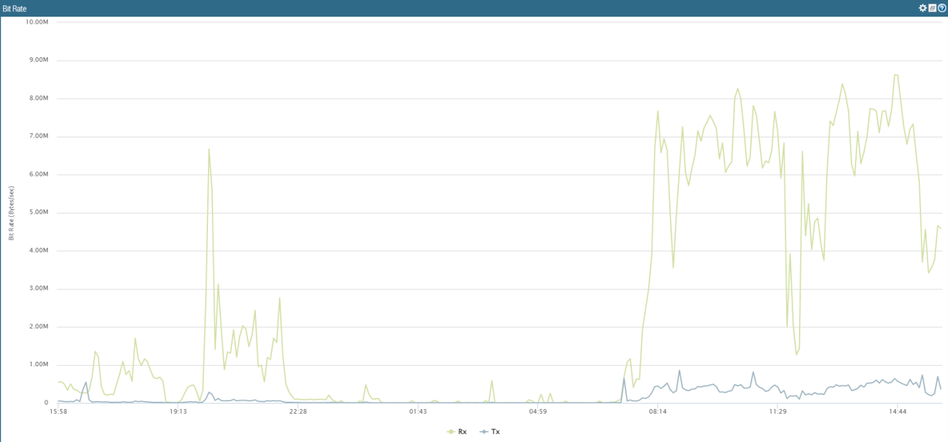
As a side comparison when we extract the bitrate graph associated with the interface used for internet communication on this firewall, from the Panorama we get something that is much more coherent :
Here we get a max throughput of roughly 9 MBytes which translates to 72 Mbps, it makes sens.
Any help on this matter would be greatly appreciated !
Thanks,
Accepted Solutions
- Mark as New
- Subscribe to RSS Feed
- Permalink
03-01-2023 03:31 AM
Hi @O.ELHANCHI ,
Note the Network Monitor graph time scale - it is one hour. This graph doesn't present throughput, but rather accumulated volume of data for one hour related to this address. This should include downloaded and uploaded data for one hour.
So the proper way to read the graph is - "550MByes of data for 1hour"
You may found the following useful for determining the current throughput:
Graphic Traffic Monitoring for Interfaces - QoS Statistics - Knowledge Base - Palo Alto Networks
How to Check Throughput of Interfaces - Knowledge Base - Palo Alto Networks
- Mark as New
- Subscribe to RSS Feed
- Permalink
03-02-2023 06:46 AM
Thank you very much for this excellent answer.
As we found the QoS real-time bandwidth graph extremely valuable, we went ahead and asked the Palo Alto support if it was possible to extract a 24 hour or more history of this graph, however, it seems like this feature hasn't been implemented in the PA-220 as of version 9.1.12-h3.
I wonder if you would happen to know more about this annex question ?
- Mark as New
- Subscribe to RSS Feed
- Permalink
03-02-2023 01:30 PM
Hi @O.ELHANCHI ,
Unfortunately I am not aware of any way to get the QoS graph for 24hour period.
You already have experience with the data that Panorama -> Managed Devices -> Health can provide.
Other option would be external SNMP monitoring system.
- 1 accepted solution
- 3425 Views
- 3 replies
- 0 Likes
Show your appreciation!
Click Accept as Solution to acknowledge that the answer to your question has been provided.
The button appears next to the replies on topics you’ve started. The member who gave the solution and all future visitors to this topic will appreciate it!
These simple actions take just seconds of your time, but go a long way in showing appreciation for community members and the LIVEcommunity as a whole!
The LIVEcommunity thanks you for your participation!
- CUSTOMER ADVISORY: Required Action for Azure hosted VM-Series & AIRS Instances in VM-Series in the Public Cloud
- High Data Plane Utilization During Business Hours in Next-Generation Firewall Discussions
- Data plane cpu 100% (pa-3410) in Next-Generation Firewall Discussions
- Test IPSEC tunnel Throughput in Next-Generation Firewall Discussions
- Impact of Rack Server Placement on Palo Alto Networks Firewall Performance in General Topics


