- Access exclusive content
- Connect with peers
- Share your expertise
- Find support resources
Click Preferences to customize your cookie settings.
Unlock your full community experience!
Strange dataplane MGMT plane behaviour
- LIVEcommunity
- Discussions
- General Topics
- Re: Strange dataplane MGMT plane behaviour
- Subscribe to RSS Feed
- Mark Topic as New
- Mark Topic as Read
- Float this Topic for Current User
- Printer Friendly Page
Strange dataplane MGMT plane behaviour
- Mark as New
- Subscribe to RSS Feed
- Permalink
07-24-2018 07:50 AM
Hi,
We are having strange behaviour with DP and MGMT plane.
We received these alarms:
show log system | match severe
2018/07/20 12:00:02 high general general 0 Dataplane under severe load
2018/07/21 12:00:02 high general general 0 Dataplane under severe load
2018/07/23 12:00:02 high general general 0 Dataplane under severe load
Looking in PA proccess, we see that when high dataplane happens we see this job (pan_summary_gen). And MGMT plane stucks in 100% during 3 minutes.
PID USER PR NI VIRT RES SHR S %CPU %MEM TIME+ COMMAND
25751 root 20 0 51240 17m 4260 R 62.4 0.4 0:02.60 pan_summary_gen
why is it happenning this behaviour? What is pan_summary_gen?
- Mark as New
- Subscribe to RSS Feed
- Permalink
07-25-2018 04:13 AM
the summary generator collects and creates summary information for reporting and ACC
It could create a little increase in DP CPU usage but should not cause a large spike (it could push the cpu over the limit if there already is a very high load at that time)
you'll want to verify more closely if the dp is already high
PANgurus - Strata & Prisma Access specialist
- Mark as New
- Subscribe to RSS Feed
- Permalink
07-26-2018 02:14 AM
Hi Reaper,
We see these events all days at the same time. Its weird. We dont have any task at that time.
show log system | match severe
2018/07/20 12:00:02 high general general 0 Dataplane under severe load
2018/07/21 12:00:02 high general general 0 Dataplane under severe load
2018/07/23 12:00:02 high general general 0 Dataplane under severe load
- Mark as New
- Subscribe to RSS Feed
- Permalink
07-26-2018 04:51 AM
Are you on a recent PAN-OS?
If you cant upgrade to the most recent OS you may want to reach out to TAC to have this reviewed
PANgurus - Strata & Prisma Access specialist
- Mark as New
- Subscribe to RSS Feed
- Permalink
07-27-2018 01:39 AM
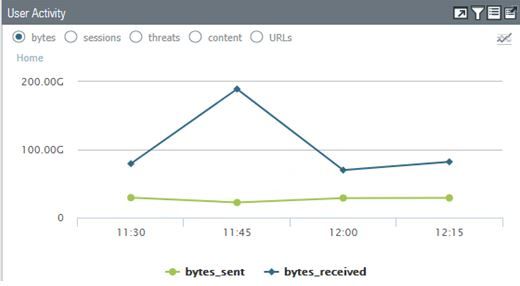
No upgrades. I was checking ACC in order to see if there is a session peaks at this time everyday. The sessions are the same but not the packet received.
In this screenshot, we see how the bytes received is increasing a lot before 12:00
We will check again the next days in order to see if this increase is happening everyday. We can confirm if this can be the root cause for DP 100%
- Mark as New
- Subscribe to RSS Feed
- Permalink
07-27-2018 01:52 AM
it seems likely there's a backup running at that time that uses a large amount of throughput/processing power
the ACC should be able to show you which session that is, by drilling down to that moment in time
PANgurus - Strata & Prisma Access specialist
- Mark as New
- Subscribe to RSS Feed
- Permalink
07-27-2018 03:23 AM - edited 07-27-2018 04:22 AM
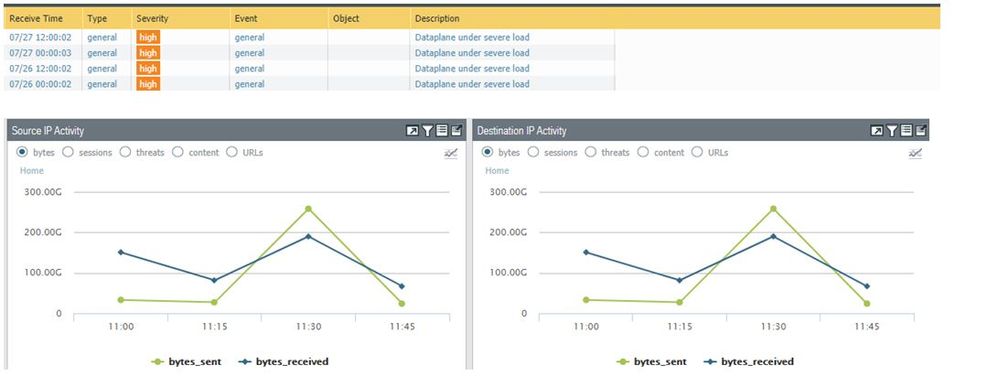
Today this increasing happened again but this time was a bit sooner. Its weird thhe dataplane event is at 12:00 and this increase was at 11:30.
there is some task done by palo alto at that time (12am and 12pm)???
- Mark as New
- Subscribe to RSS Feed
- Permalink
07-27-2018 04:43 AM
A single session can consume a lot of bandwidth, there does not need to be a correlation between throughput and the number of sessions
The easiest way to spot which sessions are _currently_ generating the most throughput is by checking the QoS statistics
have you checked which process exactly is taking up processing cycles?
> show running resource-monitor
PANgurus - Strata & Prisma Access specialist
- Mark as New
- Subscribe to RSS Feed
- Permalink
07-27-2018 07:30 AM
To add to what was already stated by @reaper remember that the ACC is reading logs, so depending on when your session starts or stops the ACC is a decent starting point to see if traffic was high. Overall though with a dataplane event like this you would need to be able to see what the actual throughput is at the time of the event.
As reaper already said this would appear to happen during a time period that businesses would normally schedule backups to run. I think you need to separate this into two different issues, because I don't personally believe they are related. The dataplane issue is much more pressing then the MGMT CPU being at 100% for a few minutes, so focus first on that. You'll likely find that the dataplane issue is caused because you are legitimately stressing the dataplane.
The mgmt cpu being at a 100% isn't a big issue and shouldn't be what you're focused on. The MGMT plane being higher at the beginning of a new day isn't abnormal, and if you are also experiancing an instance where the firewall is also having to log more sessions at the same time this could explain the MGMT CPU issue.
One thing I haven't seen just yet is what platform you are using?
- 4424 Views
- 8 replies
- 0 Likes
Show your appreciation!
Click Accept as Solution to acknowledge that the answer to your question has been provided.
The button appears next to the replies on topics you’ve started. The member who gave the solution and all future visitors to this topic will appreciate it!
These simple actions take just seconds of your time, but go a long way in showing appreciation for community members and the LIVEcommunity as a whole!
The LIVEcommunity thanks you for your participation!
- Global Protect 6.2.X, HIP Match and Fedora 41 in GlobalProtect Discussions
- Cortex XDR-Agent failed to generate support File - Error 13 - Error 109 in Cortex XDR Discussions
- Validating Branch-to-branch IPv6 Connectivity in Prisma SD-WAN Discussions
- A very weird Behavior on SIP traffic traffic reversing back to the same egress interface in General Topics
- User ID Anomalies in General Topics


