- Access exclusive content
- Connect with peers
- Share your expertise
- Find support resources
Click Preferences to customize your cookie settings.
Unlock your full community experience!
Nominated Discussion: Understanding Network Throughput Graphs
- LIVEcommunity
- Articles
- General Articles
- Nominated Discussion: Understanding Network Throughput Graphs
- Subscribe to RSS Feed
- Mark as New
- Mark as Read
- Printer Friendly Page
- Mark as New
- Subscribe to RSS Feed
- Permalink
on 03-07-2023 12:05 PM - edited on 03-09-2023 11:28 AM by jforsythe
This Nominated Discussion Article is based on the post "Network Throughput Graphs are incoherent in PA-220" by @AlanDeBoer and responded to by @aleksandar.astardzhiev . Read on to see the solution!
Hi,
We are experiencing an issue with the PA-220 network graphs displayed in one of our sites.
We know that the router in front of the firewall delivers a 90 Mbps (Megabit per second) max throughput. This measure has been verified extensively.
However when trying to visualize the traffic received by our test machine from the firewall web GUI, we notice some extremely high values in the hundreds of MegaBytes.
This test machine is connected to the PA through a single NIC card, and the test consisted in a standard online bandwidth test service.
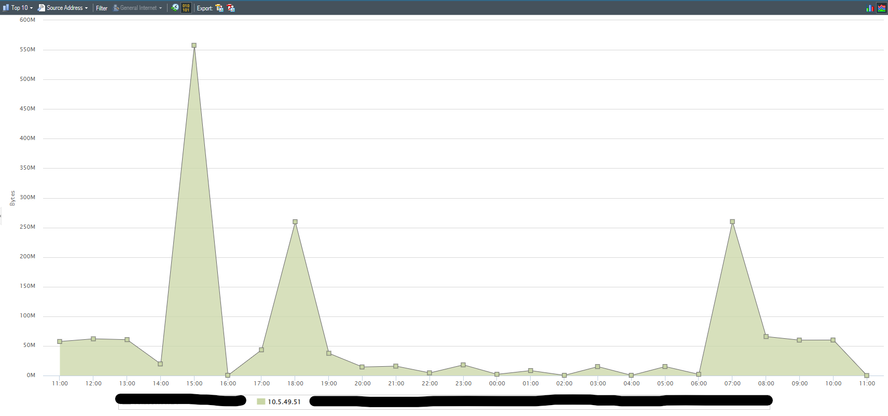
For instance at 15:00, according to the graph below our machine would have received roughly 550 MBytes of data in 1 second? That's just impossible ...
How am I supposed to read this graph and could there be an issue with the scale?
This is the Network Monitor graph for the test machine : ( TBN that we get similar values when using the Ingress/Egress Interface Widget Graph from the ACC and filter using the same IP)
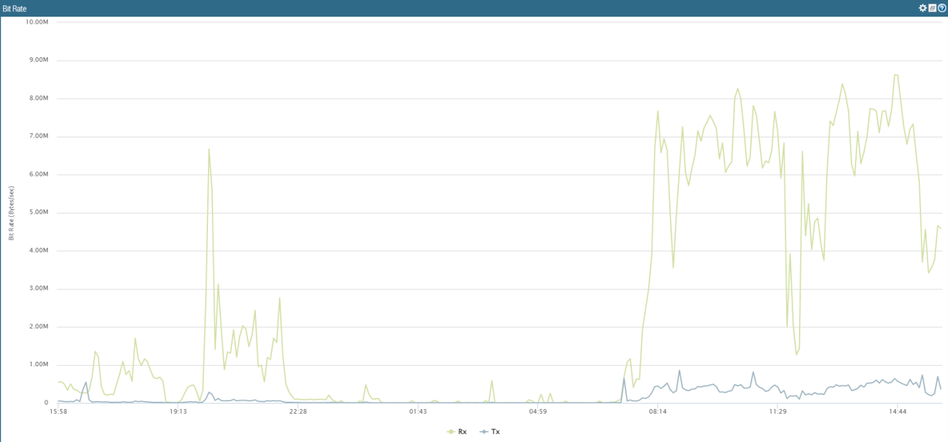
As a side comparison when we extract the bitrate graph associated with the interface used for internet communication on this firewall, from the Panorama we get something that is much more coherent :
Here we get a max throughput of roughly 9 MBytes which translates to 72 Mbps, it makes sense.
Any help on this matter would be greatly appreciated!
Thanks,
The Network Monitor graph time scale - it is one hour. This graph doesn't present throughput, but rather accumulated volume of data for one hour related to this address. This should include downloaded and uploaded data for one hour.
So the proper way to read the graph is - "550MByes of data for 1hour"
You may found the following useful for determining the current throughput:
Graphic Traffic Monitoring for Interfaces - QoS Statistics - Knowledge Base - Palo Alto Networks
How to Check Throughput of Interfaces - Knowledge Base - Palo Alto Networks
- 4237 Views
- 0 comments
- 0 Likes
- Custom Signatures With ChatGPT and AI Security in General Articles
- A Guide to NAT on Palo Alto Networks Firewalls in Support FAQ
- Nominated Discussion: HSCI and HA in General Articles
- Nominated Discussion: Understanding Signature Versions in General Articles
- Nominated Discussion: Understanding QoS in General Articles
-
"Address Objects"
1 -
10.0
1 -
10.1
1 -
10.2
2 -
ACC
1 -
Active-Passive
1 -
AD
1 -
address objects
1 -
admin roles
1 -
Administration
6 -
Administrator Profile
1 -
ADNS
1 -
Advanced DNS Security
1 -
Advanced URL Filtering
2 -
Advanced WildFire
1 -
AI
2 -
AI Security
1 -
AI Threat
1 -
AIOPS
1 -
Ansible
1 -
antivirus
1 -
API
1 -
App-ID
1 -
applications
2 -
APS
1 -
Artificial Intelligence
1 -
Asset Management
1 -
Authentication
6 -
Authentication Profile
1 -
Authentication Sequence
1 -
automatically acquire commit lock
1 -
Automation
3 -
aws
3 -
Basic Configuration
4 -
Beacon
1 -
Best Practices
6 -
Block List
1 -
categories
1 -
certificates
1 -
Certification
1 -
Certifications
1 -
Certifications & Exams
1 -
CLI
5 -
CLI command
3 -
Cloud Automation
1 -
Cloud Identity Engine
1 -
cloud ngfw
1 -
cloud security
1 -
Collector Group
1 -
Commit and Push
1 -
Commit Process
1 -
Configuration
8 -
Configuration and Management
3 -
Configure Next Generation Firewall
1 -
console
1 -
Cortex
1 -
Cortex Data Lake
2 -
Cortex XDR
3 -
CPSP
1 -
Custom Signatures
3 -
cyber elite
1 -
cyberelite
11 -
Cybersecurity
1 -
dag
1 -
DDoS
1 -
Debug
1 -
debugging
2 -
Default Policy
1 -
discussions
1 -
DLP
1 -
EDL
2 -
education
1 -
Education and Training
1 -
Education Services
1 -
Educational Services
1 -
Effective Routing
1 -
End to End Encryption
1 -
Endpoint
1 -
export
1 -
failover
1 -
FAQ
1 -
file upload
1 -
Filtering
2 -
Firewall
2 -
Firewall VM-Series
2 -
Focused Services
3 -
Focused Services Proactive Insights
2 -
gateway
1 -
Gateway Load Balancer
2 -
GCP
2 -
GCP Firewall
1 -
geolocation
1 -
Getting Started
1 -
GitHub
1 -
Global Protect
1 -
Global Protect Cookies
1 -
GlobalProtect
7 -
GlobalProtect App
1 -
globalprotect gateway
1 -
GlobalProtect Portal
2 -
google
2 -
Google Cloud
3 -
google cloud platform
2 -
Hardware
2 -
Header Insertion
1 -
High Availability
1 -
How to
1 -
HTTP
1 -
https
1 -
Hybrid Cloud
1 -
ike
3 -
import
1 -
Installation & Upgrade
1 -
IoT
1 -
IPSec
4 -
IPSec VPN Administration
1 -
kerberos
1 -
Layer 2
1 -
Layer 3
1 -
Learning
1 -
licenses
1 -
local user
3 -
Log Cluster Design
1 -
Log Collection
3 -
Log Collector Design
2 -
Logging
1 -
login
1 -
Logs
3 -
Management
8 -
Management & Administration
5 -
MFA
1 -
Microsoft
1 -
Microsoft 365
1 -
Migration
1 -
minemeld
4 -
multi factor authentication
1 -
multi-factor authentication
1 -
multi-vsys
1 -
NAT
1 -
NetSec
1 -
NetSec Newsletter
1 -
network security
34 -
Network Security Management
1 -
Network-Security
1 -
Networking
1 -
newsletter
2 -
Next Generation Firewall
4 -
Next-Generation Firewall
42 -
next-generation firewall. network security
1 -
Next-Generation Firewall. NGFW
6 -
NGFW
30 -
NGFW Configuration
11 -
NGFW Newsletter
1 -
Nominated Discussion
1 -
Objects
2 -
OTP
1 -
PA-3200 Series
1 -
PA-400
1 -
pa-440
2 -
PA-5400 series
1 -
PA-800 Series
1 -
pa-820 firewall
1 -
Packet Buffer
1 -
packet debug
1 -
packet diag
1 -
PAN-OS
16 -
PAN-OS 10.2
1 -
PAN-OS 11.0
1 -
PAN-OS Prisma Access
1 -
Panorama
11 -
Panorama Configuration
2 -
PBF
1 -
PCNSA
1 -
PCNSE
1 -
performance
2 -
policies
2 -
policy
3 -
Policy Based Forwarding
1 -
Prisma Access
7 -
Prisma AIRS
1 -
Prisma SASE
2 -
Prisma SD-WAN
1 -
proactive insights
2 -
Prompt Poaching
1 -
Radius
1 -
Ransomware
1 -
RBI
2 -
region
1 -
Registration
1 -
Remote Browser Isolation
3 -
reporting and logging
1 -
RestAPI
1 -
Risk Management
1 -
Routing
1 -
SAML
1 -
SASE
1 -
script
2 -
SD WAN
1 -
SDWAN
1 -
Search
1 -
Security Advisory
1 -
Security automation
1 -
security policy
4 -
security profile
1 -
Security Profiles
2 -
Selective Push
1 -
Session Packet
1 -
Setup & Administration
8 -
Site-to-Site VPN
1 -
Split Tunneling
2 -
SSL
1 -
SSL Decryption
2 -
SSL Forward Proxy
1 -
SSO
1 -
Strata Cloud Manager
1 -
Strata Logging Service
2 -
Support Guidance
1 -
syslog
1 -
system modes
1 -
Tag
2 -
tags
2 -
Terraform
2 -
Threat
1 -
threat log
1 -
Threat Prevention
1 -
Threat Prevention License
1 -
Tips & Tricks
1 -
TLS
1 -
traffic_log
1 -
Traps
1 -
Troubleshoot
2 -
Troubleshoot. logs
1 -
Troubleshooting
6 -
tunnel
2 -
Tutorial
2 -
Unified Monitoring
1 -
upgrade
1 -
upgrade-downgrade
2 -
url categories
1 -
URL Filtering
2 -
URL-Filtering
1 -
User ID Probing
1 -
User-ID
1 -
User-ID & Authentication
1 -
User-ID mapping
1 -
userid
1 -
VM Series
1 -
VM-Series
7 -
VM-Series on AWS
3 -
VM-Series on GCP
2 -
VPC Flow logs
1 -
VPN
3 -
VPNs
4 -
Vulnerability
2 -
Vulnerability Protection
1 -
WhatsApp
1 -
WildFire
2 -
Wildfire License
1 -
wmi
1 -
XDR
1 -
xml
2 -
XML API
2
- Previous
- Next


