Cacti - Templates

cancel
Showing results for 
Show  only  | Search instead for 
Did you mean: 
Announcements
Please sign in to see details of an important advisory in our Customer Advisories area.

Cacti - Templates

L2 Linker

Hello Palo Alto Community,

I created a few Cacti Templates which allow you to quickly and easily monitor Palo Alto Networks firewalls with SNMP.  There are 5 different templates corresponding to the 5 different Firewall families, PA-200, PA-500, PA-20xx, PA-40xx, PA-50xx.

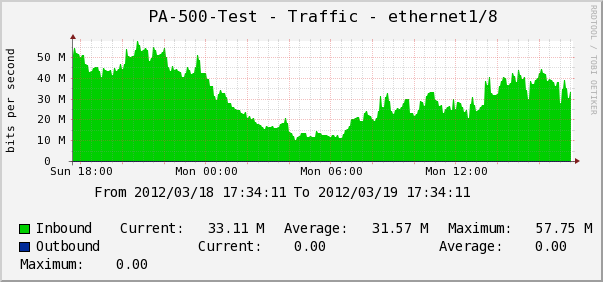
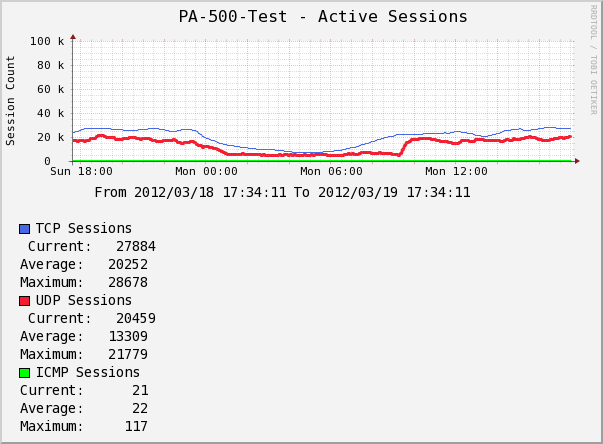
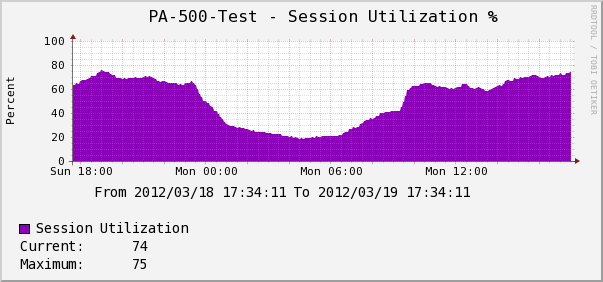
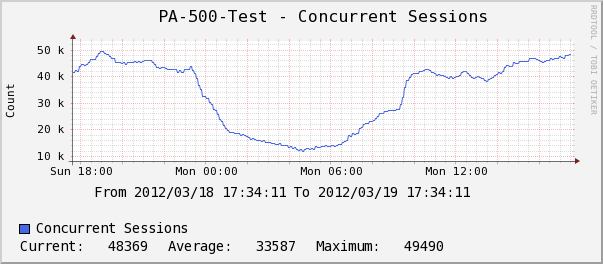
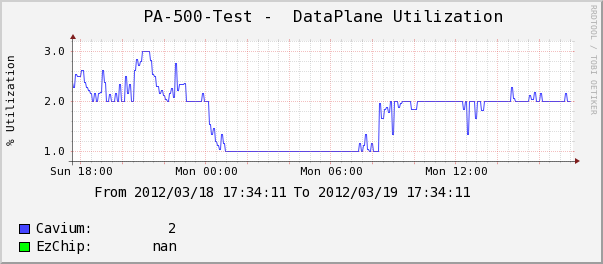
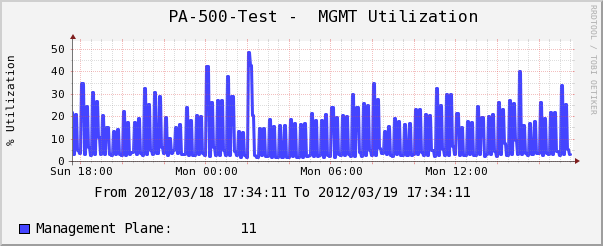
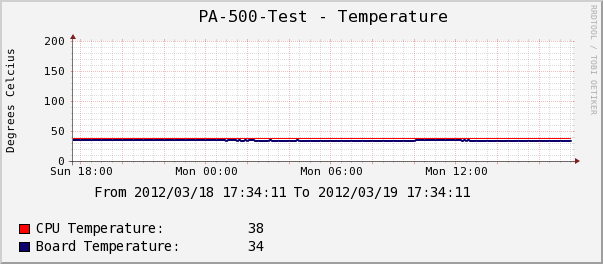
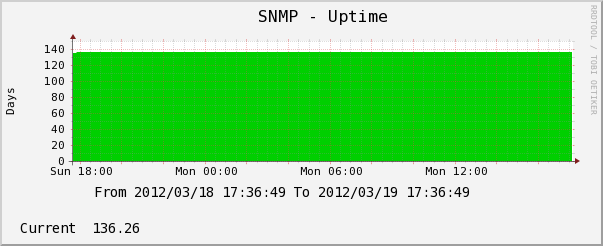
Using these with Cacti (www.cacti.net), these Host templates will monitor the following sets variables, create historical graphs of these variables (example Graphs listed below):

  • Traffic the firewall is passing through each selected interface(s)
  • The number of Active Sessions (TCP, UDP and ICMP)
  • The number of Concurrent Sessions (aggregate of Active Sessions)
  • Session Utilization Percentage – Based on the PAN Firewall Model
  • Temperature of the Firewall
  • Uptime of the Firewall

If you know of other OIDs which you feel the broader community would like monitored, I would be happy to add them to the templates.

Once cacti is installed on your favorite OS, you simply connect to the Cacti web interface and import these host templates.  Then you can add devices for Cacti to SNMP Poll/Monitor and you have a long term graphical representation of what the firewall is doing, how much traffic it is seeing, how many sessions it is supporting, etc.

Hope these help,

Kameron

Interface-Traffic.pngSessions.png

Session-Utilization.png

Concurrent-Sessions.png

DataPlane-Utilization.png

Management-Utilization.png

Temperature.png

Uptime.png

39 REPLIES 39

kklein wrote:

However, you can easily upgrade the VM by logging in as root and issue the command "yum -y update".  Feel free to read up on this prior to upgrading it.

Update successful - even the first-run Cacti update Just Worked (which is very outside my past experience with such upgrades).

Thanks, Kameron. Now I'm getting all the graphs I want out of Cacti.

Cheers

L3 Networker

Hi,

Thanks for sharing from me too 🙂

I have just two questions (obviously not being a cacti wizard):

The interface statistics images' Title is composed by these fields: |host_description| - Traffic - |query_ifName|

However 'query_ifName' does only return 'Ethernet1/1' etc.  I'm using the interface's Comment field to save a friendly name of the interface's subnet / zone.  Is the Interface.Comment field also accessible in cacti?  Knowing the zone name would render the interface graphs a lot more easy to understand..

Also I would like to display a few of these bandwidth graphs on web pages generated at another webserver.  Is it possible for the other webserver to somehow update and fetch the single graph images from the cacti server?  They will be used on an info screen displaying technical info from many devices...

Thanks for comments on  this

regards

Tor

Not applicable

hi, i can't monitor active session, but i can monitor interface traffic; do you know what's happen?

imgur: the simple image sharer

Ted, it is very difficult to say without some details.  I would look at the logs to see what is happening on the Cacti server.

I am having a similar issue. The templates load fine and I can SNMP against the palo alto device to grab the interfaces and template graphs for active sessions, temperature, etc. However, the graphs sit at 0, with no data being displayed. I've refreshed a few times over the course of an hour or so, and this is the active unit.


Has anyone run into this before?


Screenshot from 2015-10-13 10:23:09.png

Since released back in 2012 some of these templates no longer work as Palo Alto has modified their OID's over the years.  Attached is the PA-500 v1.1 template.


http://forums.cacti.net/viewtopic.php?f=12&t=44560&p=267761#p267761


Would attach here but no idea how to attach a file in this forum

L0 Member

Hello

Thank's for sharing, is there any template for palo alto VM? I have some palo alto devices (PA VM 9.1.7 PA VM 8.0.5 
PA VM 8.1.2 ) that I want to graph in cacti, should I use a different template or the same you attached.

Regards

L0 Member

Have these been updated to reflect the newer models. I'm having trouble monitoring interfaces for our PA-8xx and PA-32xx models.


Thanks!

They are a community effort and I quit using Cacti sometime ago.  Feel free to update them on the Cacti site and link them.  Updating is pretty trivial, they are just definition files and OID's.

L0 Member

Hello Kklien,


Thanks for the above 5 Cacti templates to monitor different PAN FW KPI using Cacti . I need some help to monitor below 2 PAN FW SNMP OID in Cacti for packet buffer utilization % and session util %. Can you create or update the existing Cacti template for the below 2 SNMP OID?


  1. PANOS % Session utilization - .1.3.6.1.4.1.25461.2.1.2.3.1.0
  2. PANOS CPU - Data Plane - .1.3.6.1.2.1.25.3.3.1.2.2

Sincerely

-PA

  • 62007 Views
  • 39 replies
  • 18 Likes
Like what you see?

Show your appreciation!

Click Like if a post is helpful to you or if you just want to show your support.

Click Accept as Solution to acknowledge that the answer to your question has been provided.

The button appears next to the replies on topics you’ve started. The member who gave the solution and all future visitors to this topic will appreciate it!

These simple actions take just seconds of your time, but go a long way in showing appreciation for community members and the LIVEcommunity as a whole!

The LIVEcommunity thanks you for your participation!