- Access exclusive content
- Connect with peers
- Share your expertise
- Find support resources
Click Preferences to customize your cookie settings.
Unlock your full community experience!
disk partitions in Panorama VM not being properly used
- LIVEcommunity
- Discussions
- General Topics
- Re: disk partitions in Panorama VM not being properly used
- Subscribe to RSS Feed
- Mark Topic as New
- Mark Topic as Read
- Float this Topic for Current User
- Printer Friendly Page
disk partitions in Panorama VM not being properly used
- Mark as New
- Subscribe to RSS Feed
- Permalink
06-05-2023 04:28 AM - edited 06-05-2023 06:04 AM
Dear Community,
I have added to Panorama VM (mode VMware ESXi) 3 extra disk units: 2TB, 2TB and 12TB.
The Panorama is acknowledging all the disk units and partitioned the 12TB unit in 6 x 2TB units, until here all good. But 4 of the partitions /dev/sdd1-3 and sdd-5 shows only 1% used. Do you have any idea why this is happening?
It appears to be available unused space and we only have 9 days of detailed log history with a an expiration-period set to 0 days.
admin@Panorama> show system disk details


Name   : sdd
State  : Present
Size   : 12582912 MB
Status : Available
Reason : Admin enabled

Name   : sdb
State  : Present
Size   : 2097152 MB
Status : Available
Reason : Admin enabled

Name   : sdc
State  : Present
Size   : 2097152 MB
Status : Available
Reason : Admin enabled

admin@Panorama> show system disk-space

Filesystem      Size  Used Avail Use% Mounted on
/dev/root       7.9G  5.0G  2.5G  68% /
none             32G  136K   32G   1% /dev
/dev/sda5        24G   20G  3.5G  85% /opt/pancfg
/dev/sda6       5.9G  2.4G  3.3G  42% /opt/panrepo
tmpfs            32G  476M   31G   2% /dev/shm
cgroup_root      32G     0   32G   0% /cgroup
/dev/sda8        32G   15G   16G  50% /opt/panlogs
/dev/loop0      9.8G   23M  9.2G   1% /opt/logbuffer
/dev/sdb1       1.7T  1.4T  236G  86% /opt/panlogs/ld1
/dev/sdd6       1.7T  1.4T  268G  84% /opt/panlogs/ld3
/dev/sdc1       1.7T  1.4T  238G  86% /opt/panlogs/ld2
/dev/sdd5       1.7T   77M  1.7T   1% /opt/panlogs/ld5
/dev/sdd4       1.7T  1.4T  269G  84% /opt/panlogs/ld4
/dev/sdd3       1.7T   77M  1.7T   1% /opt/panlogs/ld7
/dev/sdd2       1.7T   77M  1.7T   1% /opt/panlogs/ld6
/dev/sdd1       1.7T   77M  1.7T   1% /opt/panlogs/ld8
tmpfs            12M   36K   12M   1% /opt/pancfg/mgmt/ssl/private
tmpfs            32M     0   32M   0% /mnt/pantmp
admin@Panorama> show system logdb-quota

Quotas:
              system: 25.00%, 3.351 GB Expiration-period: 0 days
              config: 30.00%, 4.021 GB Expiration-period: 0 days
         hip-reports: 1.00%, 0.134 GB Expiration-period: 0 days
             appstat: 35.00%, 4.692 GB Expiration-period: 0 days

Disk usage:
system: Logs and Indexes: 3.4GB Current Retention: 57 days
config: Logs and Indexes: 3.3GB Current Retention: 1341 days
appstatdb: Logs and Indexes: 4.7GB Current Retention: 233 days
hip-reports: Logs and Indexes: 0 Current Retention: 0 days

Slot:0
        Quotas:
                detailed: 60.00%, 282 GB Expiration-period: 0 days
                summary: 30.00%, 141 GB Expiration-period: 0 days
                infra_audit: 5.00%, 24 GB Expiration-period: 0 days
                platform: 0.10%, 0 GB Expiration-period: 0 days
                external: 0.10%, 0 GB Expiration-period: 0 days

        Disk usage:
                detailed: Logs: 273764 MB, Current Retention: 8 days
                summary: Logs: 136926 MB, Current Retention: 45 days
                infra_audit: Logs: 22816 MB, Current Retention: 138 days
                platform: Logs: 0 MB, Current Retention: 0 days
                external: Logs: 0 MB, Current Retention: 0 days

Slot:1
        Quotas:
                detailed: 60.00%, 282 GB Expiration-period: 0 days
                summary: 30.00%, 141 GB Expiration-period: 0 days
                infra_audit: 5.00%, 24 GB Expiration-period: 0 days
                platform: 0.10%, 0 GB Expiration-period: 0 days
                external: 0.10%, 0 GB Expiration-period: 0 days

        Disk usage:
                detailed: Logs: 273759 MB, Current Retention: 8 days
                summary: Logs: 136914 MB, Current Retention: 45 days
                infra_audit: Logs: 19673 MB, Current Retention: 138 days
                platform: Logs: 0 MB, Current Retention: 0 days
                external: Logs: 0 MB, Current Retention: 0 days

Slot:2
        Quotas:
                detailed: 60.00%, 282 GB Expiration-period: 0 days
                summary: 30.00%, 141 GB Expiration-period: 0 days
                infra_audit: 5.00%, 24 GB Expiration-period: 0 days
                platform: 0.10%, 0 GB Expiration-period: 0 days
                external: 0.10%, 0 GB Expiration-period: 0 days

        Disk usage:
                detailed: Logs: 273756 MB, Current Retention: 8 days
                summary: Logs: 136916 MB, Current Retention: 45 days
                infra_audit: Logs: 15684 MB, Current Retention: 138 days
                platform: Logs: 0 MB, Current Retention: 0 days
                external: Logs: 0 MB, Current Retention: 0 days

Slot:3
        Quotas:
                detailed: 60.00%, 282 GB Expiration-period: 0 days
                summary: 30.00%, 141 GB Expiration-period: 0 days
                infra_audit: 5.00%, 24 GB Expiration-period: 0 days
                platform: 0.10%, 0 GB Expiration-period: 0 days
                external: 0.10%, 0 GB Expiration-period: 0 days

        Disk usage:
                detailed: Logs: 273769 MB, Current Retention: 8 days
                summary: Logs: 136914 MB, Current Retention: 45 days
                infra_audit: Logs: 15598 MB, Current Retention: 138 days
                platform: Logs: 0 MB, Current Retention: 0 days
                external: Logs: 0 MB, Current Retention: 0 days
Thank you in advance for your answers!
- Mark as New
- Subscribe to RSS Feed
- Permalink
06-09-2023 08:30 AM
Hi @Carracido ,
If you go to Panorama -> Managed Collectors -> <panorama-hostname> -> Disks
Do you see all the disks added as "enabled disks"? If you click on "add" can you add more from the list?
If you go to Panorama -> Collecto Groups -> Local_Log_Collector -> General
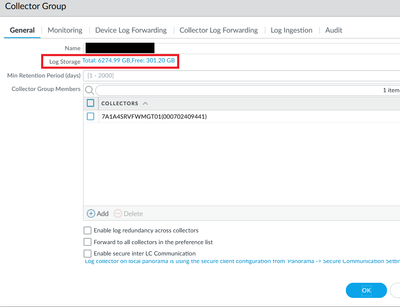
What do you see for "Log storage"? When you click on it, what do you see for "Total"
- Mark as New
- Subscribe to RSS Feed
- Permalink
06-16-2023 03:33 AM
Hello Aleksandar,
Thank you for your answer.
There are 4 disks added to the local collector and no more can be added
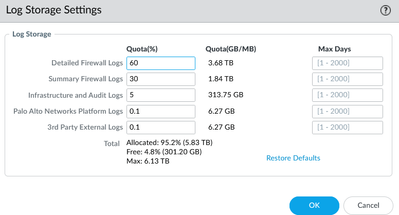
Collector´s max log storage is 6,2TB.
Adding screen-shots of collector log-quotas.
It seems it doesn´t make the right disk allocation for logs. What do you think?
- Mark as New
- Subscribe to RSS Feed
- Permalink
06-20-2023 12:09 AM
Hi @Carracido ,
I believe you need to perform steps 2 and 3 from the following link - https://docs.paloaltonetworks.com/panorama/9-1/panorama-admin/set-up-panorama/set-up-the-panorama-vi...
The docs also mention
In Panorama mode, you can add disk sizes larger than 2TB and Panorama will automatically create as many 2TB partitions as possible. For example, if disk sdc was 24TB, it will create 12 2TB partitions. These disks will be named sdc1-12.So it is expected what you see for your 12TB disk to be split in 6 partitions.
You probably need to run
> request system disk add sdd
# Your 12TB disk
After that you should be able to add more disks in Panorama -> Managed Collectors -> <panorama-hostname> -> Disks (explained as step 3 in the docs)
- 3142 Views
- 3 replies
- 0 Likes
Show your appreciation!
Click Accept as Solution to acknowledge that the answer to your question has been provided.
The button appears next to the replies on topics you’ve started. The member who gave the solution and all future visitors to this topic will appreciate it!
These simple actions take just seconds of your time, but go a long way in showing appreciation for community members and the LIVEcommunity as a whole!
The LIVEcommunity thanks you for your participation!
- Does thePAN 11.1.13 on panorama will work on local FW that is using 10.1.13-hr? in Panorama Discussions
- Failover is not occurring on the passive device properly. in General Topics
- Does Panorama Forward These Events to External SIEMs via Syslog by Default? in Panorama Discussions
- SCP Dynamic updates in Panorama Discussions
- cannot commit as one service keeps shutting down in General Topics


