- Access exclusive content
- Connect with peers
- Share your expertise
- Find support resources
Click Preferences to customize your cookie settings.
Unlock your full community experience!
GlobalProtect App Log Collection and Troubleshooting FAQ
- LIVEcommunity
- Products
- Network Security
- GlobalProtect
- GlobalProtect Articles
- GlobalProtect App Log Collection and Troubleshooting FAQ
- Subscribe to RSS Feed
- Mark as New
- Mark as Read
- Printer Friendly Page
- Mark as New
- Subscribe to RSS Feed
- Permalink
on 03-03-2021 09:14 AM
This FAQ is about the feature described here.
Is this feature available for Prisma Access and NGFW customers?
GlobalProtect App Log Collection is available for Prisma Access customers using 1.8 Plugin and above. It will be available soon for NGFW customers.
What platforms is this feature available for?
Windows, macOS, Linux, Android, and iOS.
Are there any OS specific limitations?
Navigate to the App Access Performance section in this document to view.
Is this feature enabled by default for all users?
Administrator has to enable this feature by setting “Enable App Log for Troubleshooting” to “Yes.” For a full list of prerequisites, visit here.
Can I enable this setting for a specific user group before doing a company-wide deployment?
Since this is available as a portal client app configuration, it can be applied to a user/user group allowing administrators to test with a small user group before attempting a company-wide deployment.
Do I have to download another certificate to secure communications between GlobalProtect on the endpoint and the Cortex Data Lake Instance?
Yes, administrators will be able to download the certificate using CLI in Prisma Access 1.8 Plugin. With Prisma Access 2.0 Innovation Plugin, administrators will be able to download the certificate using the Cloud Services plugin UI. For Prisma Access Tenants, the certificate will get downloaded to Mobile_User_Template and Location “Shared.” With NGFW deployments, admin can choose a template/template stack to download to, that the portal configuration is a part of.
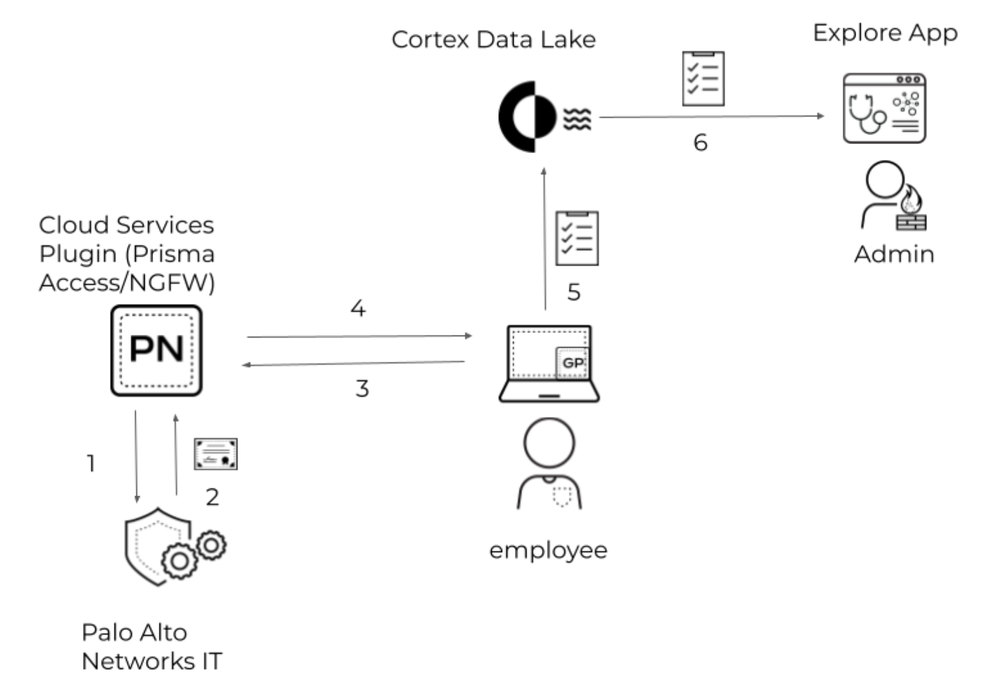
Is there a diagram that explains how this works?
- Admin requests the certificate from Panorama using Cloud Services Plugin 1.8 (using CLI) / 2.0 Innovation Plugin (using UI). Only innovation plugin would support the UI to generate and download the certificate.
- Certificate is downloaded to Panorama cert Store (1.8), Mobile_User_Template (Prisma Access Deployment), or template/template stack of admin’s choosing in case of NGFW. Admin decides to push the certificate via portal configuration.
- GlobalProtect authenticates with the portal
- GlobalProtect downloads the certificate
- Whenever user has authentication, network, or connectivity issues, user reports using the GlobalProtect App
- These logs would be made available on Explore App
What do the logs contain? How different is it from the manual collection of logs?
Logs contain troubleshooting and diagnostics data improving the overall quality of information and presented in an easy-to-read format enhancing administrator’s ability to quickly troubleshoot connectivity, authentication, and performance issues. Troubleshooting logs contain information specific to portal and gateway connectivity, and the network state of the endpoint. Diagnostics data contains data related to the Endpoint State, Gateway Network Impairments, GlobalProtect App Health, and App Access Performance. It is worth noting that the debug log bundle (collected manually via Troubleshooting tab on GlobalProtect or via Explore App) will also contain troubleshooting and diagnostic logs.
What information do each of the above troubleshooting and diagnostics tests contain?
For a full list, navigate here.
Are the diagnostic tests done with/without GlobalProtect tunnel?
Yes, the Diagnostic Network Latency measurement tests are done once via GlobalProtect and once via physical adapter for administrators to compare and contrast what the latency measurements between endpoint and destination urls look like across the different interfaces.
Where are the logs sent?
Logs reported by end-users are sent to the customer’s Cortex Data Lake tenant and these logs are made available via the Explore App.
Can the GlobalProtect App Troubleshooting logs be forwarded from Cortex Data Lake?
Log-forwarding is currently not supported. Coming soon in a future release.
Hi
In a Panorama managed Prisma scenario does this feature require the Autonomous DEM add-on license?
Thanks
We have open case with TAC more than 6 months whenever users connect to GP it internet brandwith drop from 1GB to 200Mbps .It had been with TAC more than 6 months no soultion more than 900 users are efffected due to this issue. Any one also have the same issue ?
- 17109 Views
- 3 comments
- 2 Likes
- Host Compliance Service for GlobalProtect in GlobalProtect Articles
- GlobalProtect Support for DHCP-Based IP Address Assignments in GlobalProtect Articles
- Updates on Certificates for GlobalProtect App Log Collection Feature in GlobalProtect Articles
- Troubleshooting GlobalProtect MTU Issues in GlobalProtect Articles
-
DHCP
1 -
ESXi
1 -
Global Protect
1 -
GlobalProtect
19 -
GlobalProtect App
1 -
globalprotect gateway
1 -
GlobalProtect-COVID19
12 -
GlobalProtect-Resources
9 -
Layer 3
1 -
NGFW Configuration
11 -
Prisma Access
1 -
PrismaAccess-COVID19
1 -
VM-Series
1
- Previous
- Next


