- Access exclusive content
- Connect with peers
- Share your expertise
- Find support resources

Choosing the right reporting software can be a tough—but crucial—decision. Good reporting helps you make better decisions and informs what is safe to ignore and what needs your attention.
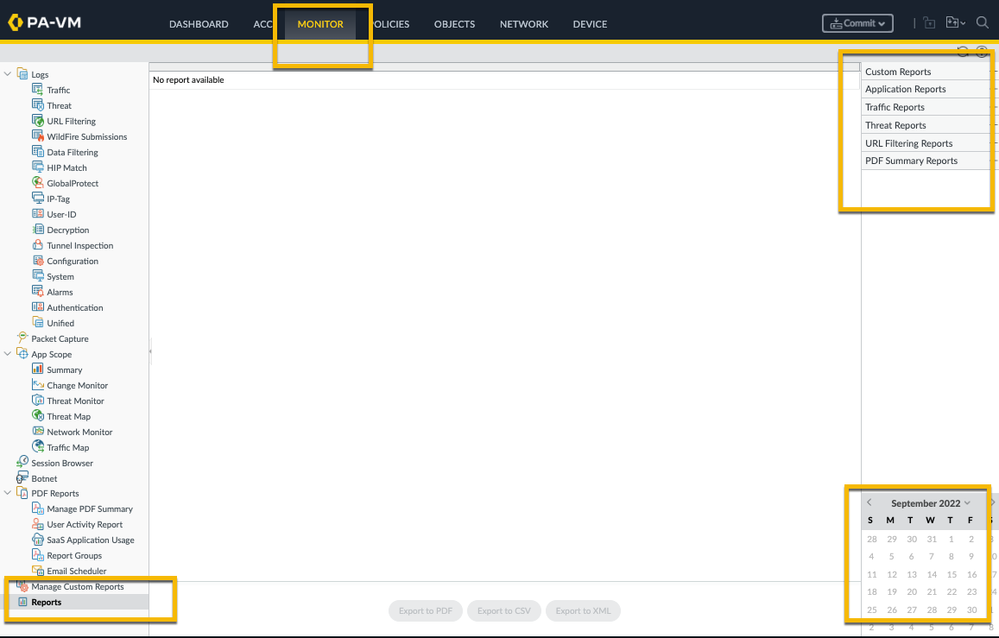
Out of the box, PAN-OS has a set of helpful, predefined reports that allow traffic visibility in the network. The reports, scheduled and generated by default, save the administrator from configuring custom reports.
You will find all of these reports at the Monitor tab > Reports. All you need to do is select the report you would like to see and the date as illustrated in the screenshot below:

Sometimes, the predefined reports don't really reflect what you need. For instance, they may not contain the desired data/columns or you would like to negate specific data. This is where custom reports come into play.
Custom Reports can be created at the Monitor tab > Manage Custom Reports
To start creating a new custom report, just hit the Add button at the bottom of the screen and you'll see the screen as displayed below. Here you can choose which database to use for your report. Notice how there are two groups to choose from, Summary Databases and Detailed Logs.
The difference between the two is that the Summary Databases are optimized and collect summarized data from the log files allowing faster report generation. The Detailed Logs allow you to crawl the log files in search of very specific data, but are indeed slower to generate as indicated.
You'll notice that the summary databases have different columns to choose from than the detailed databases. For example, the Summary URL Database can report which categories and domains were accessed X number of times, while the Detailed URL Log can report exact URLs accessed from a certain source.
Once you've selected your database, enable the schedule and set a timeframe.
Note: If you don't schedule the report you can only run the report manually. Scheduled reports are stored on the firewall and can be configured to be mailed out periodically.
Next, add the columns you're interested in. If you're unsure where to begin, use the Load Template button at the top right. In this example, I used the Top Security Rules template.
You'll notice that your custom report uses the configuration from the template you selected, which you can then further customize.
If you click the Run Now button at the top, a sample report is generated. Review the report to see if you're happy with the information presented, or if additional edits are needed to get the exact custom report you desire.
In this case, I wanted to make some changes. I added the Action column and chose to group my logs by Action as displayed below.
Notice how different the report looks after I run it again:
Using the Query Builder, you can fine tune the report. If you want to filter out the Rule 'Allowed Personal Apps,' you can create a filter as displayed below.
If you run the report again, you'll notice that the information for 'Allowed Personal Apps' is no longer included in the report.
Once you commit this, the report will be added to the scheduled reports job that runs every night and become available in the custom reports viewer. You can add them into a report group, which in turn can be added to an Email Scheduler so it gets mailed to you periodically.
Feel free to share your questions, comments and ideas in the section below!
Thank you for taking time to read this blog.
Don't forget to hit the Like (thumbs up) button and to Subscribe to the LIVEcommunity Blog area.
Kiwi out!
You must be a registered user to add a comment. If you've already registered, sign in. Otherwise, register and sign in.
| Subject | Likes |
|---|---|
| 3 Likes | |
| 3 Likes | |
| 2 Likes | |
| 2 Likes | |
| 2 Likes |
| User | Likes Count |
|---|---|
| 5 | |
| 5 | |
| 3 | |
| 2 | |
| 2 |


