- Access exclusive content
- Connect with peers
- Share your expertise
- Find support resources
Click Preferences to customize your cookie settings.
Unlock your full community experience!
Custom reports problem
- LIVEcommunity
- Discussions
- General Topics
- Re: Custom reports problem
- Subscribe to RSS Feed
- Mark Topic as New
- Mark Topic as Read
- Float this Topic for Current User
- Printer Friendly Page
Custom reports problem
- Mark as New
- Subscribe to RSS Feed
- Permalink
04-23-2018 11:49 PM
We have problems with creating custom reports
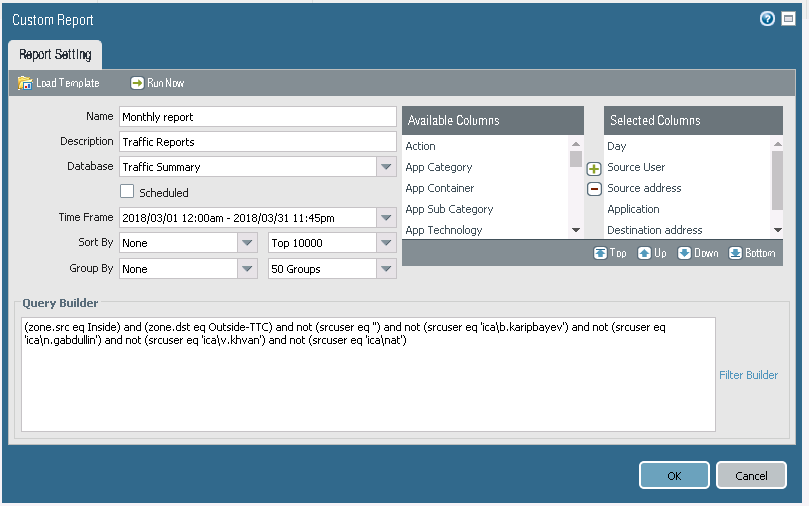
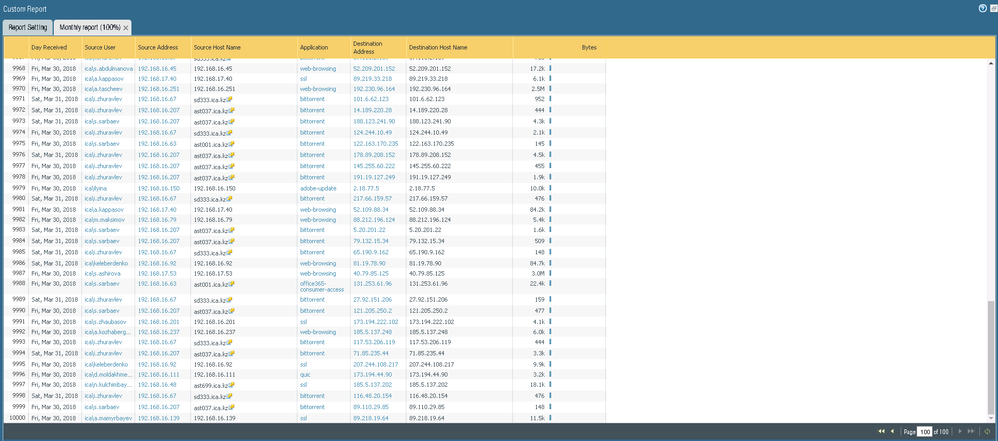
We configured custom reports as we need pointing the time interval for one month but the report shows us only two last days of the previous month.
i can also show you
admin@PA-3020> show system logdb-quota
Quotas:
system: 4.00%, 3.231 GB Expiration-period: 0 days
config: 4.00%, 3.231 GB Expiration-period: 0 days
alarm: 3.00%, 2.423 GB Expiration-period: 0 days
appstat: 4.00%, 3.231 GB Expiration-period: 0 days
hip-reports: 1.00%, 0.808 GB Expiration-period: 0 days
traffic: 30.00%, 24.231 GB Expiration-period: 0 days
threat: 16.00%, 12.923 GB Expiration-period: 0 days
trsum: 7.00%, 5.654 GB Expiration-period: 0 days
hourlytrsum: 3.00%, 2.423 GB Expiration-period: 0 days
dailytrsum: 1.00%, 0.808 GB Expiration-period: 0 days
weeklytrsum: 1.00%, 0.808 GB Expiration-period: 0 days
urlsum: 2.00%, 1.615 GB Expiration-period: 0 days
hourlyurlsum: 1.00%, 0.808 GB Expiration-period: 0 days
dailyurlsum: 1.00%, 0.808 GB Expiration-period: 0 days
weeklyurlsum: 1.00%, 0.808 GB Expiration-period: 0 days
thsum: 2.00%, 1.615 GB Expiration-period: 0 days
hourlythsum: 1.00%, 0.808 GB Expiration-period: 0 days
dailythsum: 1.00%, 0.808 GB Expiration-period: 0 days
weeklythsum: 1.00%, 0.808 GB Expiration-period: 0 days
userid: 1.00%, 0.808 GB Expiration-period: 0 days
application-pcaps: 1.00%, 0.808 GB Expiration-period: 0 days
extpcap: 1.00%, 0.808 GB Expiration-period: 0 days
debug-filter-pcaps: 1.00%, 0.808 GB Expiration-period: 0 days
dlp-logs: 1.00%, 0.808 GB Expiration-period: 0 days
hipmatch: 3.00%, 2.423 GB Expiration-period: 0 days
gtp: 2.00%, 1.615 GB Expiration-period: 0 days
gtpsum: 1.00%, 0.808 GB Expiration-period: 0 days
hourlygtpsum: 0.75%, 0.606 GB Expiration-period: 0 days
dailygtpsum: 0.75%, 0.606 GB Expiration-period: 0 days
weeklygtpsum: 0.75%, 0.606 GB Expiration-period: 0 days
auth: 1.00%, 0.808 GB Expiration-period: 0 days
sctp: 0.00%, 0.000 GB Expiration-period: 0 days
sctpsum: 0.00%, 0.000 GB Expiration-period: 0 days
hourlysctpsum: 0.00%, 0.000 GB Expiration-period: 0 days
dailysctpsum: 0.00%, 0.000 GB Expiration-period: 0 days
weeklysctpsum: 0.00%, 0.000 GB Expiration-period: 0 days
Disk usage:
traffic: Logs and Indexes: 25G Current Retention: 22 days
threat: Logs and Indexes: 13G Current Retention: 35 days
system: Logs and Indexes: 72M Current Retention: 161 days
config: Logs and Indexes: 177M Current Retention: 67 days
alarm: Logs and Indexes: 32K Current Retention: 0 days
trsum: Logs and Indexes: 5.7G Current Retention: 48 days
hourlytrsum: Logs and Indexes: 2.4G Current Retention: 15 days
dailytrsum: Logs and Indexes: 779M Current Retention: 11 days
weeklytrsum: Logs and Indexes: 736M Current Retention: 62 days
thsum: Logs and Indexes: 788M Current Retention: 65 days
hourlythsum: Logs and Indexes: 807M Current Retention: 42 days
dailythsum: Logs and Indexes: 818M Current Retention: 65 days
weeklythsum: Logs and Indexes: 475M Current Retention: 62 days
appstatdb: Logs and Indexes: 147M Current Retention: 67 days
userid: Logs and Indexes: 837M Current Retention: 10 days
hipmatch: Logs and Indexes: 32K Current Retention: 0 days
extpcap: Logs and Indexes: 28K Current Retention: 0 days
urlsum: Logs and Indexes: 1.7G Current Retention: 49 days
hourlyurlsum: Logs and Indexes: 819M Current Retention: 32 days
dailyurlsum: Logs and Indexes: 794M Current Retention: 46 days
weeklyurlsum: Logs and Indexes: 773M Current Retention: 62 days
gtp: Logs and Indexes: 24K Current Retention: 0 days
gtpsum: Logs and Indexes: 560K Current Retention: 0 days
hourlygtpsum: Logs and Indexes: 544K Current Retention: 0 days
dailygtpsum: Logs and Indexes: 536K Current Retention: 0 days
weeklygtpsum: Logs and Indexes: 80K Current Retention: 0 days
auth: Logs and Indexes: 24K Current Retention: 0 days
sctp: Logs and Indexes: 16K Current Retention: 0 days
sctpsum: Logs and Indexes: 296K Current Retention: 0 days
hourlysctpsum: Logs and Indexes: 8.0K Current Retention: 0 days
dailysctpsum: Logs and Indexes: 8.0K Current Retention: 0 days
weeklysctpsum: Logs and Indexes: 8.0K Current Retention: 0 days
application: Logs and Indexes: 383M Current Retention: 67 days
filters: Logs and Indexes: 4.0K Current Retention: 0 days
dlp: Logs and Indexes: 4.0K Current Retention: 0 days
hip_report_base: Logs and Indexes: 1.1M Current Retention: N/A
wildfire: Logs and Indexes: 120K Current Retention: N/A
Space reserved for cores: 0MB
- Mark as New
- Subscribe to RSS Feed
- Permalink
04-24-2018 12:51 AM
Hi @Radmin_85,
The GUI view is more restricted in the number of lines it can display.
Try exporting to a CSV report ... default max rows is 65535 but you can increase it to max value of 1048576 :
Cheers !
-Kiwi.
Cheers,
Kiwi
Please help out other users and “Accept as Solution” if a post helps solve your problem !
Read more about how and why to accept solutions.
- Mark as New
- Subscribe to RSS Feed
- Permalink
04-24-2018 02:24 AM
Hi @Radmin_85,
Sorry I missed this in your first post but ... custom reports do have a max of top 10000.
The limit I was referring to is when you pull a report from the traffic logs directly. Add your filter to the traffic logs view and add a timeframe :
Your filter + ( receive_time leq '2018/04/13 13:45:12' ) and ( receive_time geq '2018/04/13 13:40:12' ) for example.
I just tested this and was able to pull out a report with 30.000+ lines.
Cheers !
-Kiwi
Cheers,
Kiwi
Please help out other users and “Accept as Solution” if a post helps solve your problem !
Read more about how and why to accept solutions.
- Mark as New
- Subscribe to RSS Feed
- Permalink
10-21-2024 06:48 AM
Hello. So, is there no way to display more than 10,000 rows while generating a custom report?
- 4431 Views
- 5 replies
- 0 Likes
Show your appreciation!
Click Accept as Solution to acknowledge that the answer to your question has been provided.
The button appears next to the replies on topics you’ve started. The member who gave the solution and all future visitors to this topic will appreciate it!
These simple actions take just seconds of your time, but go a long way in showing appreciation for community members and the LIVEcommunity as a whole!
The LIVEcommunity thanks you for your participation!
- [SOLVED] Panorama's SAML-Based Administrator Cannot See Other Administrators And Generate TSFs in Panorama Discussions
- Panorama PDF summary report of 1 week/month in Panorama Discussions
- Issues with credit card processing terminals in Next-Generation Firewall Discussions
- PAN-OS 11.1.13 Predefined reports displaying IPv4 addresses in IPv6 format in General Topics
- Is it possible to configure a custom report into graph or chart format, similar to the options available for predefined reports? in General Topics


