- Access exclusive content
- Connect with peers
- Share your expertise
- Find support resources
Click Preferences to customize your cookie settings.
Unlock your full community experience!
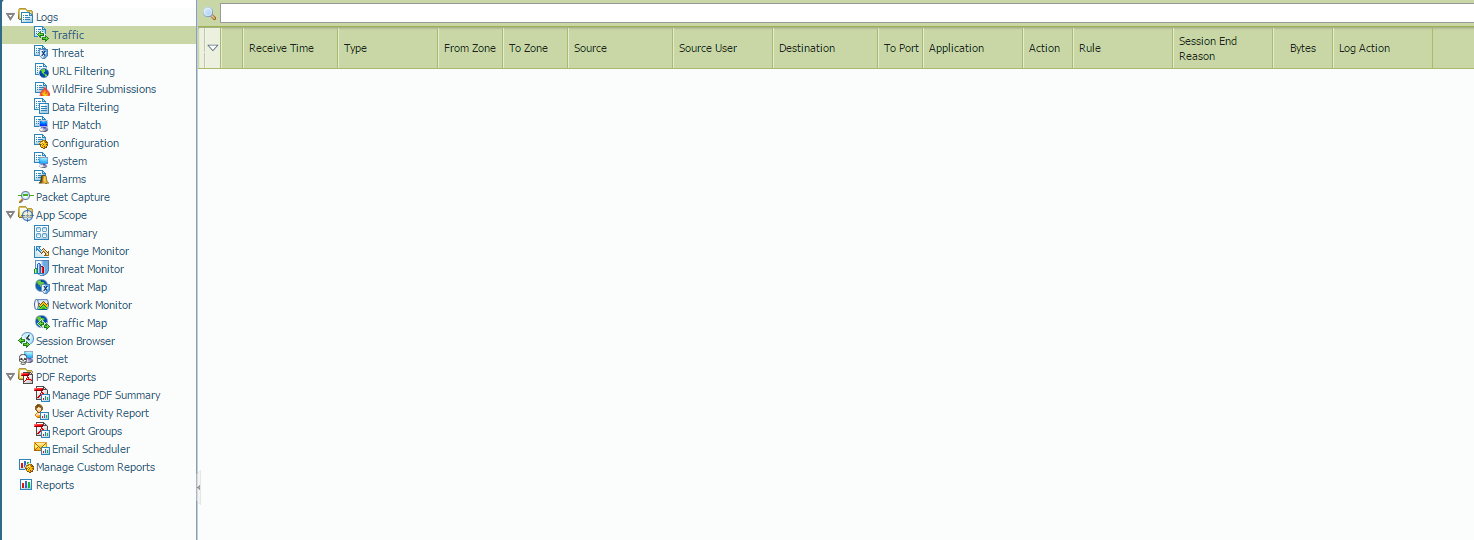
No traffic in traffic log - VM100
- LIVEcommunity
- Discussions
- General Topics
- No traffic in traffic log - VM100
- Subscribe to RSS Feed
- Mark Topic as New
- Mark Topic as Read
- Float this Topic for Current User
- Printer Friendly Page
No traffic in traffic log - VM100
- Mark as New
- Subscribe to RSS Feed
- Permalink
12-17-2014 03:28 PM
Hi Guys,
Following on from my last post - Site-to-Site VPN - Palo alto to Cisco Router issue
i am experiencing an issue with my PA VM100, there is nothing in the traffic logs....
this is running on VMWare workstation 11

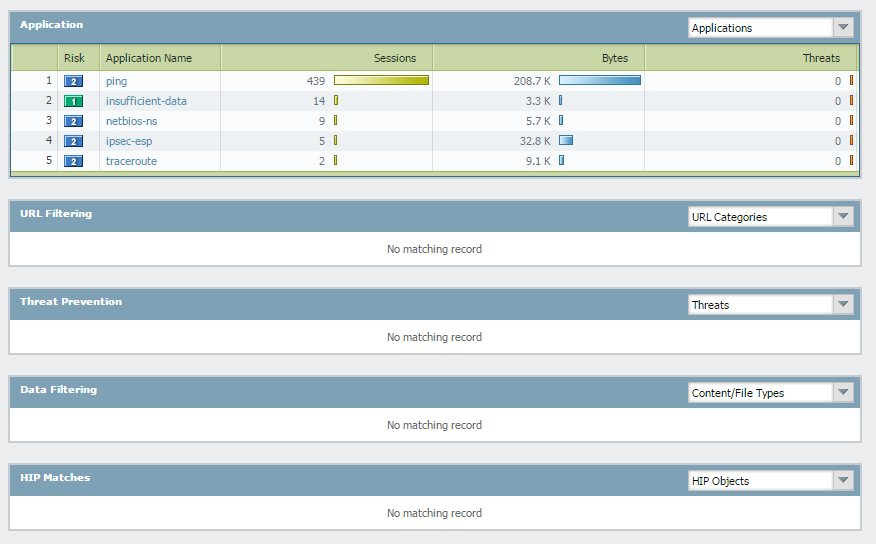
But there is traffic flowing through the firewall 100%, it is functioning perfectly, with the exception of the lack of traffic logs ![]()
Here is the output of sh log traffic
admin@PA-VM> show log traffic
Time App From Src Port Source
Rule Action To Dst Port Destination
Src User Dst User End Reason
===============================================================================
admin@PA-VM>

- Labels:
-
Set Up
- Mark as New
- Subscribe to RSS Feed
- Permalink
12-17-2014 03:30 PM
Hi netsupport1
***EDIT: I thought logs are not being forwarded to Panorama, changed my post
Could you verify if logs are being written to the disk (2-3 times):
debug log-receiver statistics
Check if storage space is fine:
show system disk-space
Hope it helps !
- Mark as New
- Subscribe to RSS Feed
- Permalink
12-17-2014 03:39 PM
Are the rules in your security policy configured to log?
Not sure how long has your firewall been running, but if this is a fresh setup and sessions just started to be created, then you won't see any logs, by default the PA firewall logs at session end.
Thanks,
- Mark as New
- Subscribe to RSS Feed
- Permalink
12-17-2014 03:44 PM
Hi Csharma,
admin@PA-VM> debug log-receiver statistics
Logging statistics
------------------------------ -----------
Log incoming rate: 0/sec
Log written rate: 0/sec
Corrupted packets: 0
Corrupted URL packets: 0
Corrupted HTTP HDR packets: 0
Logs discarded (queue full): 0
Traffic logs written: 380
URL logs written: 0
Wildfire logs written: 0
Anti-virus logs written: 0
Widfire Anti-virus logs written: 0
Spyware logs written: 0
Attack logs written: 0
Vulnerability logs written: 0
Fileext logs written: 0
URL cache age out count: 0
URL cache full count: 0
URL cache key exist count: 0
URL cache wrt incomplete http hdrs count: 0
URL cache rcv http hdr before url count: 0
URL cache full drop count(url log not received): 0
URL cache age out drop count(url log not received): 0
Traffic alarms dropped due to sysd write failures: 0
Traffic alarms dropped due to global rate limiting: 0
Traffic alarms dropped due to each source rate limiting: 0
Traffic alarms generated count: 0
Log Forward count: 0
Log Forward discarded (queue full) count: 0
Log Forward discarded (send error) count: 0
Summary Statistics:
Num current drop entries in trsum:0
Num cumulative drop entries in trsum:0
Num current drop entries in thsum:0
Num cumulative drop entries in thsum:0
External Forwarding stats:
Type Enqueue Count Send Count Drop Count Queue Depth Send Rate(last 1min)
syslog 0 0 0 0 0
snmp 0 0 0 0 0
email 0 0 0 0 0
raw 0 0 0 0 0
admin@PA-VM> debug log-receiver statistics
Logging statistics
------------------------------ -----------
Log incoming rate: 0/sec
Log written rate: 0/sec
Corrupted packets: 0
Corrupted URL packets: 0
Corrupted HTTP HDR packets: 0
Logs discarded (queue full): 0
Traffic logs written: 382
URL logs written: 0
Wildfire logs written: 0
Anti-virus logs written: 0
Widfire Anti-virus logs written: 0
Spyware logs written: 0
Attack logs written: 0
Vulnerability logs written: 0
Fileext logs written: 0
URL cache age out count: 0
URL cache full count: 0
URL cache key exist count: 0
URL cache wrt incomplete http hdrs count: 0
URL cache rcv http hdr before url count: 0
URL cache full drop count(url log not received): 0
URL cache age out drop count(url log not received): 0
Traffic alarms dropped due to sysd write failures: 0
Traffic alarms dropped due to global rate limiting: 0
Traffic alarms dropped due to each source rate limiting: 0
Traffic alarms generated count: 0
Log Forward count: 0
Log Forward discarded (queue full) count: 0
Log Forward discarded (send error) count: 0
Summary Statistics:
Num current drop entries in trsum:0
Num cumulative drop entries in trsum:0
Num current drop entries in thsum:0
Num cumulative drop entries in thsum:0
External Forwarding stats:
Type Enqueue Count Send Count Drop Count Queue Depth Send Rate(last 1min)
syslog 0 0 0 0 0
snmp 0 0 0 0 0
email 0 0 0 0 0
raw 0 0 0 0 0
admin@PA-VM>
admin@PA-VM> show system disk-space
Filesystem Size Used Avail Use% Mounted on
/dev/sda2 4.0G 1.6G 2.3G 42% /
/dev/sda5 8.0G 563M 7.0G 8% /opt/pancfg
/dev/sda6 4.0G 461M 3.4G 12% /opt/panrepo
tmpfs 2.0G 1.6G 504M 76% /dev/shm
/dev/sda8 16G 200M 15G 2% /opt/panlogs
admin@PA-VM>
- Mark as New
- Subscribe to RSS Feed
- Permalink
12-17-2014 03:46 PM
Hi Parmas,
Yep they are very simple; permit all from in to out and out to in, this is just a lab, all rules logging at session start and end.

- Mark as New
- Subscribe to RSS Feed
- Permalink
12-17-2014 03:51 PM
Hi netsupport1
Could you please check, traffic logs from CLI of the PAN-VM firewall.
>show log traffic direction equal backward
In case, you are able to see logs from CLI, but not in the GUI, then we might need to reset below mentioned 2 daemons in the Management-plane.
>debug software restart web-server
>debug software restart management-server
Thanks
- Mark as New
- Subscribe to RSS Feed
- Permalink
12-17-2014 04:07 PM
Hi again HULK!
admin@PA-VM> show log traffic direction equal backward
Time App From Src Port Source
Rule Action To Dst Port Destination
Src User Dst User End Reason
===============================================================================
admin@PA-VM>
- Mark as New
- Subscribe to RSS Feed
- Permalink
12-17-2014 04:18 PM
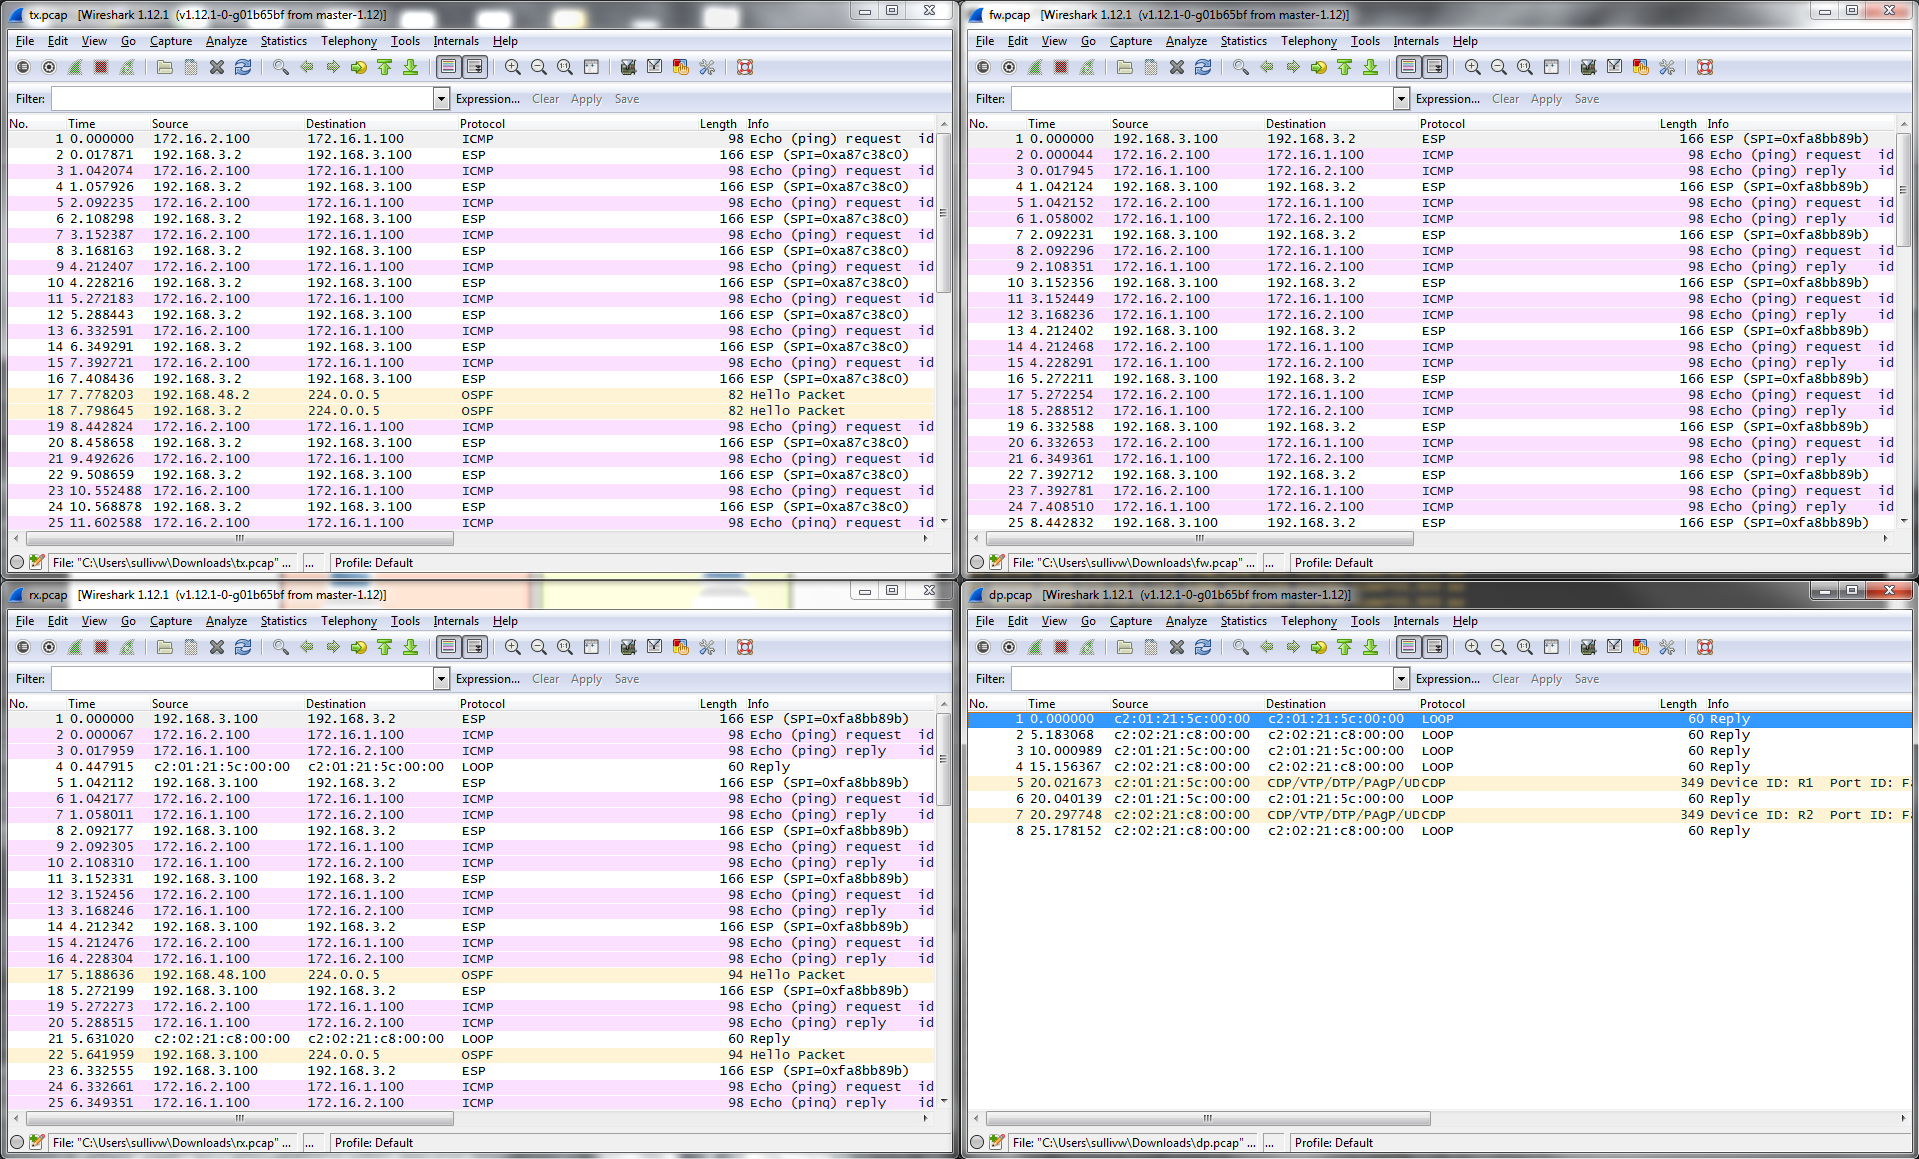
I ran a packet capture for all stages, all are picking up packets;

- Mark as New
- Subscribe to RSS Feed
- Permalink
12-17-2014 04:39 PM
Could you Please let me know, through which policy traffic is passing .
You may check it from CLI:
For example:
admin@34-PA-3020> show session all
--------------------------------------------------------------------------------
ID Application State Type Flag Src[Sport]/Zone/Proto (translated IP[Port])
Vsys Dst[Dport]/Zone (translated IP[Port])
--------------------------------------------------------------------------------
16 ssl ACTIVE FLOW 10.66.18.38[40097]/untrust-L3/6 (10.66.18.38[40097]) >>>>>>>>>>> session ID 16
vsys1 10.66.24.34[5007]/untrust-L3 (10.66.24.34[5007])
admin@34-PA-3020> show session id 16
Session 16
c2s flow:
source: 10.66.18.38 [untrust-L3]
dst: 10.66.24.34
proto: 6
sport: 40097 dport: 5007
state: ACTIVE type: FLOW
src user: unknown
dst user: unknown
s2c flow:
source: 10.66.24.34 [untrust-L3]
dst: 10.66.18.38
proto: 6
sport: 5007 dport: 40097
state: ACTIVE type: FLOW
src user: unknown
dst user: unknown
qos node: ethernet1/3, qos member N/A Qid -2
start time : Wed Dec 10 14:48:05 2014
timeout : 1800 sec
time to live : 1797 sec
total byte count(c2s) : 27551725
total byte count(s2c) : 25732297
layer7 packet count(c2s) : 248039
layer7 packet count(s2c) : 219956
vsys : vsys1
application : ssl
rule : default >>>>>>>>>>>>>>>>>> name of the rule.
session to be logged at end : False
session in session ager : True
session synced from HA peer : False
layer7 processing : completed
URL filtering enabled : False
session via syn-cookies : False
session terminated on host : True
session traverses tunnel : False
captive portal session : False
ingress interface : ethernet1/3
egress interface : ethernet1/3
session QoS rule : N/A (class 4)
tracker stage l7proc : ctd decoder bypass
Thanks
- Mark as New
- Subscribe to RSS Feed
- Permalink
12-17-2014 04:54 PM
admin@PA-VM> show session all
--------------------------------------------------------------------------------
ID Application State Type Flag Src[Sport]/Zone/Proto (translated IP[Port])
Vsys Dst[Dport]/Zone (translated IP[Port])
--------------------------------------------------------------------------------
901 ping ACTIVE FLOW 172.16.2.100[30501]/Outside/1 (172.16.2.100[30501])
vsys1 172.16.1.100[18]/Inside (172.16.1.100[18])
351 ciscovpn ACTIVE FLOW 192.168.3.2[500]/Outside/17 (192.168.3.2[500])
vsys1 192.168.3.100[500]/Outside (192.168.3.100[500])
825 ipsec-esp ACTIVE TUNN 192.168.3.2[5378]/Outside/50 (192.168.3.2[52372])
vsys1 192.168.3.100[63229]/Outside (192.168.3.100[4975])
898 ping ACTIVE FLOW 172.16.2.100[30245]/Outside/1 (172.16.2.100[30245])
vsys1 172.16.1.100[17]/Inside (172.16.1.100[17])
896 ping ACTIVE FLOW 172.16.2.100[29221]/Outside/1 (172.16.2.100[29221])
vsys1 172.16.1.100[14]/Inside (172.16.1.100[14])
897 ping ACTIVE FLOW 172.16.2.100[29733]/Outside/1 (172.16.2.100[29733])
vsys1 172.16.1.100[15]/Inside (172.16.1.100[15])
899 ping ACTIVE FLOW 172.16.2.100[29989]/Outside/1 (172.16.2.100[29989])
vsys1 172.16.1.100[16]/Inside (172.16.1.100[16])
admin@PA-VM> show session id 901
Session 901
c2s flow:
source: 172.16.2.100 [Outside]
dst: 172.16.1.100
proto: 1
sport: 30501 dport: 18
state: ACTIVE type: FLOW
src user: unknown
dst user: unknown
s2c flow:
source: 172.16.1.100 [Inside]
dst: 172.16.2.100
proto: 1
sport: 18 dport: 30501
state: ACTIVE type: FLOW
src user: unknown
dst user: unknown
start time : Thu Dec 18 02:53:02 2014
timeout : 6 sec
time to live : 1 sec
total byte count(c2s) : 98
total byte count(s2c) : 98
layer7 packet count(c2s) : 1
layer7 packet count(s2c) : 1
vsys : vsys1
application : ping
rule : Outside in
session to be logged at end : True
session in session ager : True
session updated by HA peer : False
layer7 processing : enabled
URL filtering enabled : False
session via syn-cookies : False
session terminated on host : False
session traverses tunnel : True
captive portal session : False
ingress interface : tunnel.1
egress interface : ethernet1/1
session QoS rule : N/A (class 4)
end-reason : unknown
admin@PA-VM>
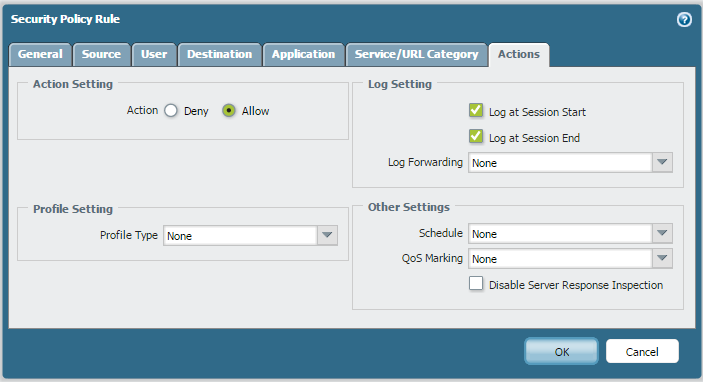
And the rule;

- Mark as New
- Subscribe to RSS Feed
- Permalink
12-17-2014 05:07 PM
Hello Netsupport1,
The traffic is passing through rule: Outside in, where logging is already enabled. Hence, could you please try below mentioned 3 commands. It will not impact to the production traffic of the PAN firewall.
> debug software restart log-receiver
>debug software restart web-server
>debug software restart management-server
Thanks
- Mark as New
- Subscribe to RSS Feed
- Permalink
12-17-2014 05:47 PM
Hi Hulk,
I tried them all this morning with no luck....
Sorry ;-(
Oh and this is a LAB not a production network, so i can do anything ![]()
Is there a command to watch traffic logs live in CLI?
- Mark as New
- Subscribe to RSS Feed
- Permalink
12-17-2014 07:25 PM
> show log traffic direction equal backward ----------- to check latest traffic logs from CLI.
- Mark as New
- Subscribe to RSS Feed
- Permalink
12-17-2014 08:19 PM
Thanks for your help Hulk, but that doesn't show any output
Anyone else got any ideas?
- Mark as New
- Subscribe to RSS Feed
- Permalink
12-17-2014 11:25 PM
can you try to clear the logs ? sometimes this work at this situation.
- 12223 Views
- 26 replies
- 0 Likes
Show your appreciation!
Click Accept as Solution to acknowledge that the answer to your question has been provided.
The button appears next to the replies on topics you’ve started. The member who gave the solution and all future visitors to this topic will appreciate it!
These simple actions take just seconds of your time, but go a long way in showing appreciation for community members and the LIVEcommunity as a whole!
The LIVEcommunity thanks you for your participation!
- Palo Windows ARP Issue - Windows Hosts Not Installing ARP info in Next-Generation Firewall Discussions
- Existing traffic stops suddenly, and changing of interface MTU resolved it. in General Topics
- Palo Alto 3410 Firewall 100% DP CPU spike in Next-Generation Firewall Discussions
- Beginner Question Understanding Basic NAT and Traffic Flow in Palo Alto Firewall in General Topics
- traffic disruption on routing change in Next-Generation Firewall Discussions


