By Gilad Mark, Senior Product Manager
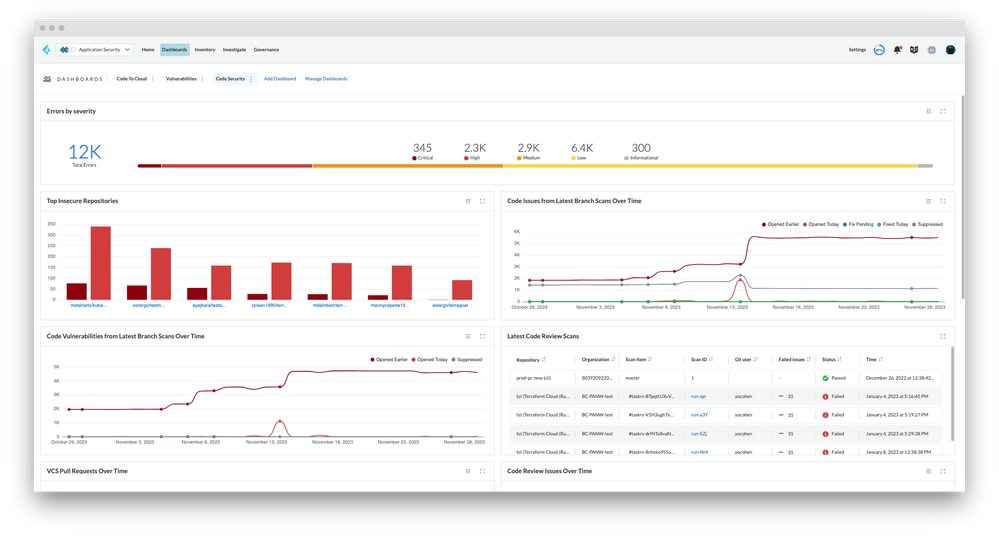
We understand the importance of providing users with a global view and actionable workflow for reducing security issues in their code. This can be achieved by giving users summary insights and a way to prioritize security concerns effectively. Introducing the Code Security Dashboard! The new Dashboard comes with brand-new graphs that cater to these needs:
- Summary insights - (“What is the current status of my Code Security posture?“)
- Errors by Severity - The error count overall and by severity.
- Top Repositories by High-Risk Code Error Count - The top 7 repositories by High and Critical error count.
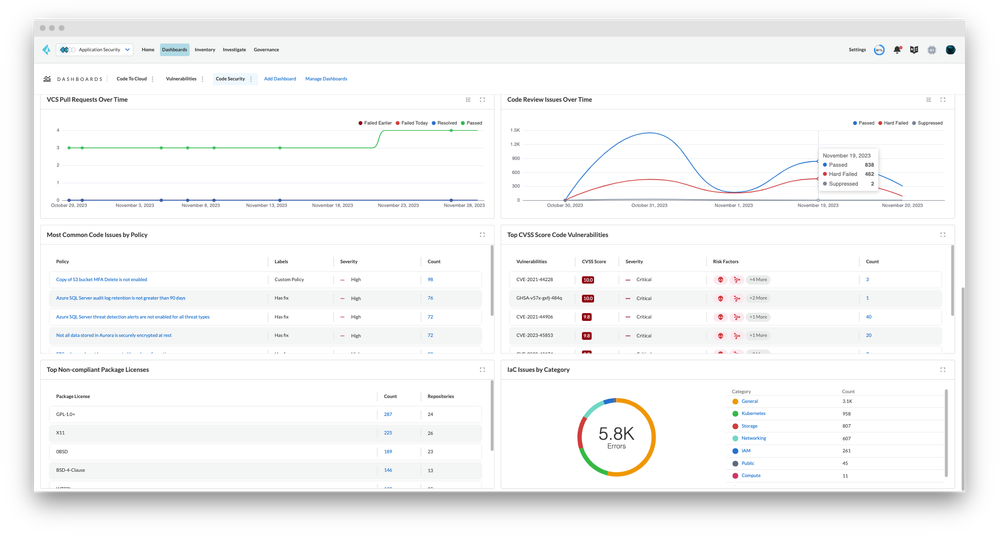
- IaC Errors by Category - The portion and count of errors by IaC category.
- CCS impact over time (30 days) - (“How are my development teams interacting with CCS guardrails I set for detection and enforcement?“)
- Code issues over time - Track how your development teams are improving as they interact with CCS guardrails for detection and enforcement. (Currently for repository default branch periodic scans only, Vulnerabilities are excluded)
- Pull Requests over time - Analyze the impact of Enforcement rules on new code deliveries. Observe the adoption of secure coding practices over time, including the reduction of failed PRs.
- Use-case driven - (“What are the urgent and common issues my organization is facing at the moment?“)
- Common Errors By Policy - View the most common errors related to IaC misconfigurations, secrets, and license policies.
- Top Non-compliant Package Licenses - Identify the most frequently occurring non-compliant package licenses.
- Top CVSS Score Code Vulnerabilities - Discover and prioritize the highest-scoring code vulnerabilities based on the CVSS score.
Navigation:
- Dashboard -> Code Security
In addition to these graphs, the Code Security Dashboard includes advanced features:
- Links to the Projects and Policies screens for further investigation
- Last scan time information
- Interest points (“events”) for over-time trends that can explain trend changes
- The number of repositories added
- The number of repositories with Enforcement added/removed
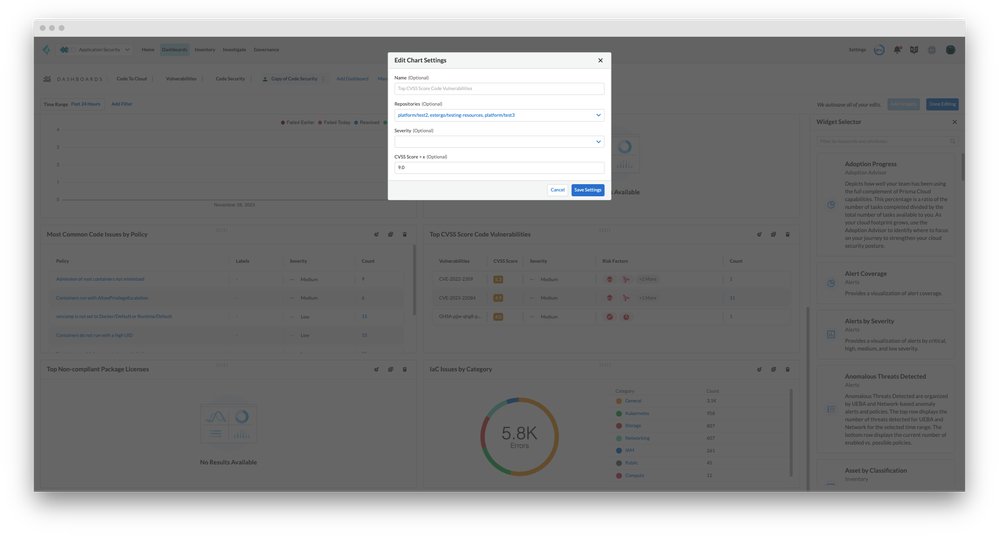
- Filters (Repository, Code Category, Severity)
Note that access to the Code Security dashboard is also supported in Custom Permission Groups (GRBAC)
Figure 1: Code Security Dashboard Demo_Palo-Alto-Networks

Figure 2: Code Security Dashboard_Palo-Alto-Networks

Figure 3: Last Scan Information_Palo-Alto-Networks

Figure 4: Edit Chart Settings_Palo-Alto-Networks


