- Access exclusive content
- Connect with peers
- Share your expertise
- Find support resources
Click Preferences to customize your cookie settings.
Unlock your full community experience!
Building a Robust and Efficient Data Ingestion Pipeline for Enhanced Observability
- LIVEcommunity
- Blogs
- Engineering Blogs
- Building a Robust and Efficient Data Ingestion Pipeline for Enhanced Observability
- Subscribe to RSS Feed
- Mark as New
- Mark as Read
- Printer Friendly Page
Written by the Garuda Team at Palo Alto Networks:
Shubham Ranjan
Pradeepkumar Vijayakumar
Anurag Reddy Ekkati
Initial Setup and Challenges
Let's take a look at our existing architecture and the challenges we've encountered with it.
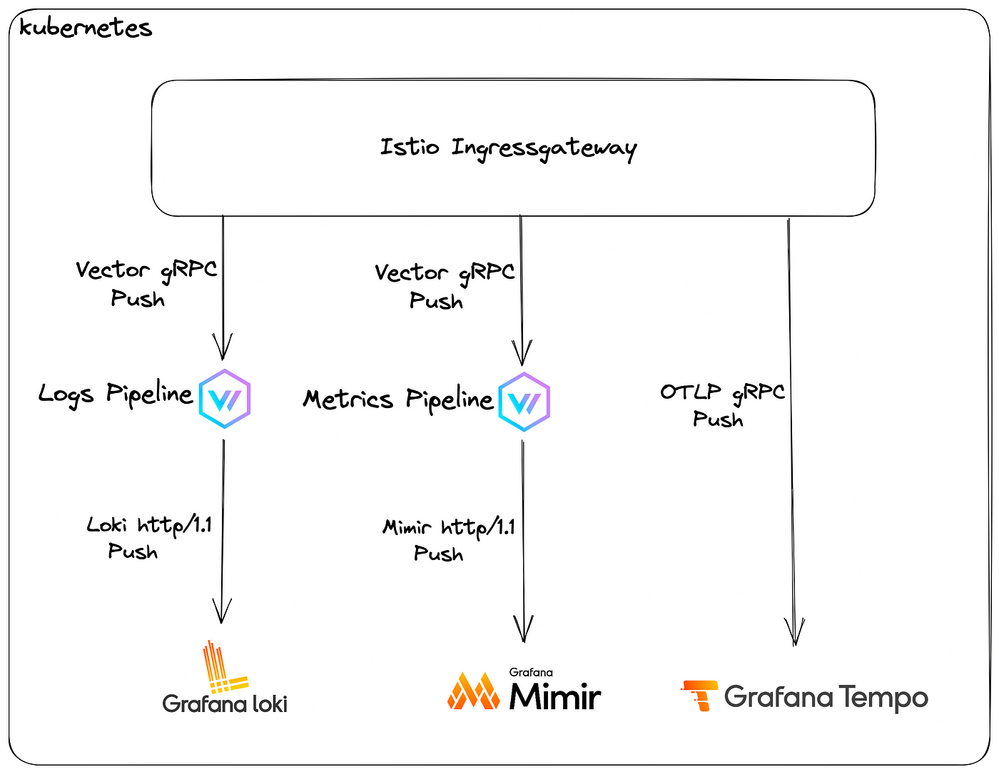
Our observability platform, Garuda, is deployed in a kubernetes cluster using Istio for service mesh and its ingress gateway for managing north-south traffic.
Tenant’s observability data from agents ends up on vector pipelines (via Istio’s ingress gateway), where transformations using vector remap language (VRL) happens, and they are further pushed to respective sinks; Grafana Loki for logs, Grafana Mimir for metrics. Traces are currently being pushed directly to the gRPC endpoint (open telemetry protocol), exposed by Grafana Tempo
However, there were several challenges with this setup:
- VRL does not perform well on high loads, making scalability a challenge for us. For e.g. in our case, it starts choking up as soon as the ingestion rate reaches 50MB/s even though it has a lot of resources allocated to it.
- If the destination sinks start responding slowly or are not available for some reason, vector starts retrying them up to a certain limit and eventually drops the data if the retries get exhausted.
- Vector pushes data to Loki and Mimir using its http endpoint, even though gRPC push is supported by both.
- The whole flow is synchronous in nature leading to high resource utilization on the agent side if Garuda starts misbehaving. Although, vector has support for message brokers like Kafka and NATS but source support is limited to output type of logs, which means for data like a metrics and trace, the payload needs to be considered as a log string and vector remaps needs to be performed to convert it to a metric/trace. We preferred avoiding this route as a little bit of VRL already seems to have been impacting the performance for us.
- With this setup, it led to Garuda’s tenants to miss data at random. It was observed that the synchronous ingestion was taking a toll on the system. The agents started to use more memory and the platform didn’t had a required ingestion rate to accommodate tenants
Scaling hardware is not a solution; we cannot keep scaling the platform and agents to support synchronous ingestion. Our primary aim was to ensure that once valid data reaches our system, we try our best to ensure it reaches its intended destination successfully.
Solution
To address these challenges, it was decided to decouple the flow via a message broker system where the publishers simply push the received data to a queue, and consumers take care of consuming the data and sending it over to its relevant destination. Several factors were considered while building this and the following steps were taken:
- Message Broker Prospects: Kafka and NATS JetStream. Although Kafka does an amazing job as a message broker, the objective was to deliver an efficient yet less resource intensive observability platform, which made NATS JetStream the right candidate, since it is written in Go, its more resource-friendly.
- To replace vector, it was decided to replace the ingress pipelines with custom implementations written in Go, as it’s very good at resource utilization and the official prometheus packages could be used directly (as they are also written in Go) for any label parsing requirements.
- GoFiber was chosen as the web server to be implemented, as it is one of the top performers on techempower benchmarks in Go that suited our needs in terms of easy implementation.
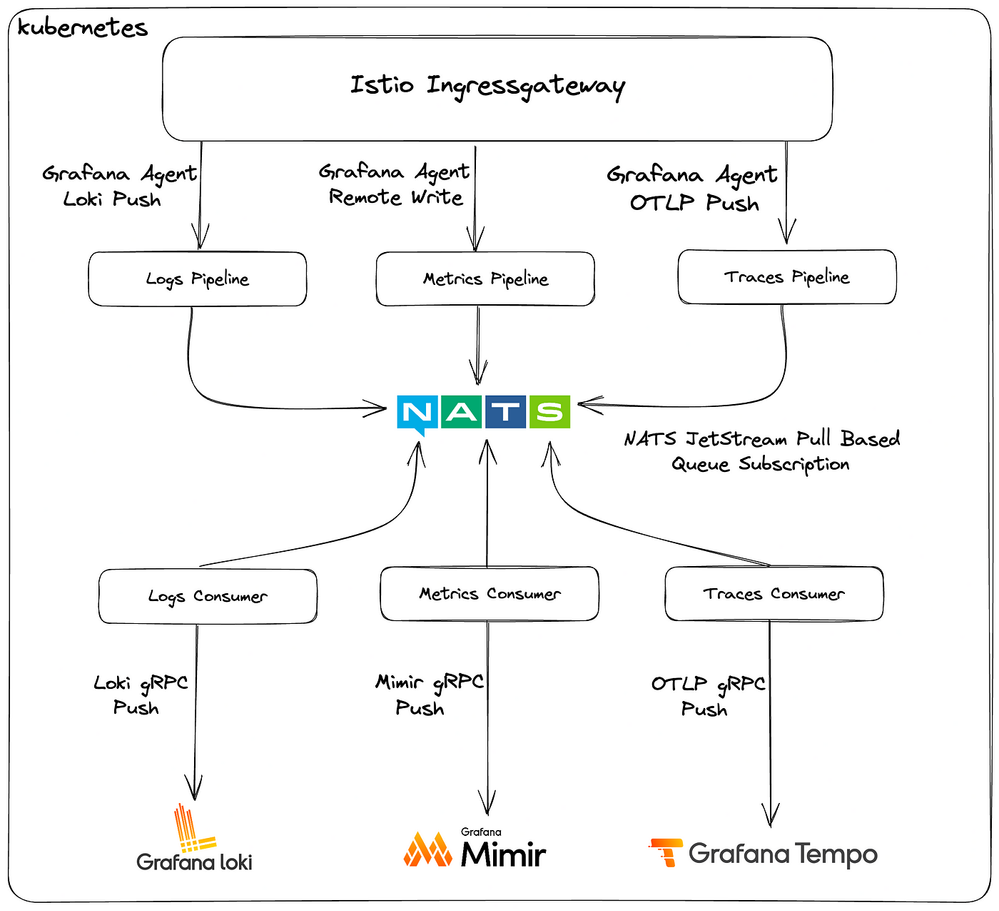
- The ingress pipeline consists of two components, a publisher and a corresponding consumer.
- Publisher simply exposes an endpoint in well-known formats (prometheus remote-write for metrics, Loki push for logs, open telemetry protocol for traces) on which it receives the data and simply pushes the payload to the corresponding NATS stream.
- Consumer (using NATS JetStream pull based queue subscription method) consumes the payload and writes the data to the respective endpoint, but using the gRPC endpoints for Loki and Mimir, which provides better ingestion performance.
- To go an extra mile in terms of performance and resource allocation, zerolog was used as the logger instead of the standard logging library for extra performance and reduced memory allocations.
Impact
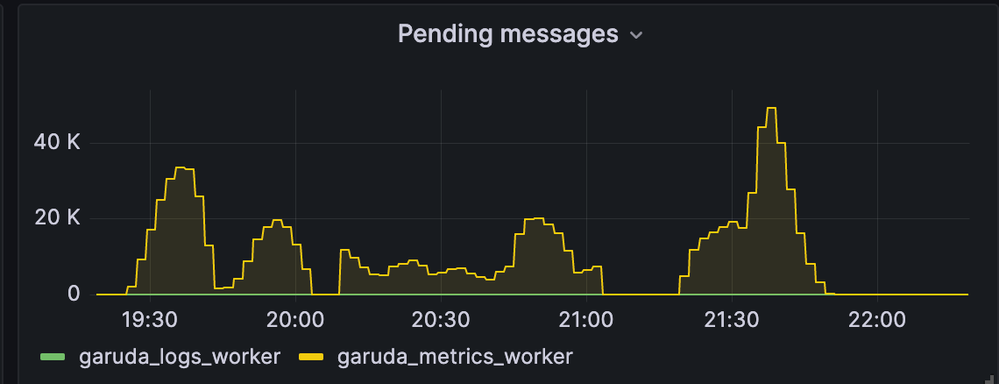
By implementing these changes, and with the same amount of resources allocated for Mimir and Loki, event drops were reduced to zero in normal conditions and tenants observed no data loss post moving to this architecture. And if there is some outage / fluctuation in the destination, the payload simply gets piled up in NATS JetStream and is ingested as soon as the destination is back up. Here’s a snap of when there was a small fluctuation in our systems:
While there was a problem at ingestion due to restart of Loki ingesters, the messages got piled up at NATS and as soon as all Loki ingesters came up, all the pending messages were successfully consumed, thus helping us avoid any data loss during the period.
Additionally, there is more control over the pipeline in terms of handling different tenants, and reduced dependency on an external tool for adding any feature if required. Even the tenant side agents have reduced memory usage due to reduced in-memory pile up as the platform now has a much higher ingestion rate.
Overall, the observability ingestion pipeline is now more performant, resilient, and reliable than ever before.
Statistics
With an ingestion at a rate of ~5.1 million metrics/s and ~420k log lines/s, here’s a snap of what kubectl top shows for a 3-node nats cluster.
Mimir Distributor Received Samples Rate
Reference Metric: cortex_distributor_received_samples_total


In terms of handling throughput, an increase of 50% is observed for metric pushed to Mimir
Loki Distributor Received Samples Rate
Reference Metric: loki_distributor_lines_received_total


In terms of handling throughput, an increase of 225% is observed for log lines pushed to Loki.
- 10824 Views
- 2 comments
- 6 Likes
-
AI
1 -
AI Engineering
1 -
Artificial Intelligence
1 -
auto-remediation
1 -
Backstage
1 -
Best Practices
1 -
Cardinality
1 -
Chatbot
1 -
Cortex
1 -
Cortex Data Lake
1 -
Cost Optimization
1 -
engineering
1 -
Engineering Blog
1 -
Enterprise AI
1 -
Garuda
2 -
Grafana
2 -
Guidance and Guidelines
1 -
IDP
1 -
Information Retrieval
1 -
Knowledge Management
1 -
Kubernetes
1 -
Langchain
1 -
LLM
1 -
Logs
1 -
Logwatch
1 -
Machine Learning
1 -
metrics
1 -
monitoring
1 -
Natural Language Processing
1 -
NLP
1 -
Observability
2 -
Palo Alto Networks
1 -
Python
1 -
Quick-Guide
1 -
RAG
1 -
RestAPI
1 -
Retrieval-Augmented Generation
1 -
Strata Logging Service
1 -
Streamlit
1 -
Synonyms
1
- Previous
- Next
- Securing Enterprise AI at Scale with Equinix and Palo Alto Networks in Community Blogs
- Breaking Barriers in Log Ingestion: 1 Million Logs/sec with Panorama in Community Blogs
- AI-Powered ADEM Value with Prisma SD WAN Branch vs 3rd Party Branch in Community Blogs
- Building an IDP with Backstage and Kubernetes: A Comprehensive Guide (Part 1) in Engineering Blogs
- Elevating Observability: Enhancing Garuda with Custom Connectors, SDK and Agents in Engineering Blogs


