- Access exclusive content
- Connect with peers
- Share your expertise
- Find support resources
Click Preferences to customize your cookie settings.
Unlock your full community experience!
Elevating Observability: Enhancing Garuda with Custom Connectors, SDK and Agents
- LIVEcommunity
- Blogs
- Engineering Blogs
- Elevating Observability: Enhancing Garuda with Custom Connectors, SDK and Agents
- Subscribe to RSS Feed
- Mark as New
- Mark as Read
- Printer Friendly Page
Written by The Observability Platform team at Palo Alto Networks:
In the dynamic landscape of modern software development, the importance of observability cannot be overstated. Comprehensive monitoring and analytics are essential for understanding application behavior, diagnosing issues, and optimizing performance. At Palo Alto Networks, we’re committed to advancing observability practices with our flagship platform, Garuda. To learn more about what Garuda is and how it enhances observability, check out this blog. In this article, we’ll explore how we’ve extended Garuda’s capabilities with custom connectors and optimized pipeline management, enabling organizations to achieve greater insights into their systems.
The Need for Custom Connectors:
Observability platforms like Garuda rely on a diverse ecosystem of data sources, spanning cloud-native environments, traditional infrastructure, and serverless architectures. However, integrating these disparate sources into a cohesive observability solution can be challenging. This is where custom connectors come into play.
Custom connectors serve as bridges between Garuda and various data-producing components within an organization’s ecosystem. They facilitate the ingestion of metrics, logs, and traces from diverse sources, ensuring comprehensive observability coverage. Without custom connectors, organizations may struggle to capture crucial observability data, limiting their ability to monitor, troubleshoot, and optimize their systems effectively.
Why Custom Connectors: Addressing Gaps in Garuda’s Observability Journey
In the evolution of Garuda, Palo Alto Networks’ observability platform, the development of custom connectors — such as the Garuda SDK, Lambda extension, and Garuda Lib — has been pivotal. Let’s delve into why each of these connectors was conceived and how they tackle crucial gaps in the observability landscape:
- Lambda Extension: Filling the AWS Lambda Observability Gap
- The Need: As Garuda expanded, one significant challenge surfaced: the extensive use of AWS Lambda within Palo Alto Networks’ product ecosystem. However, existing open-source solutions could not seamlessly integrate Lambda logs with Garuda’s logging solution, Loki.
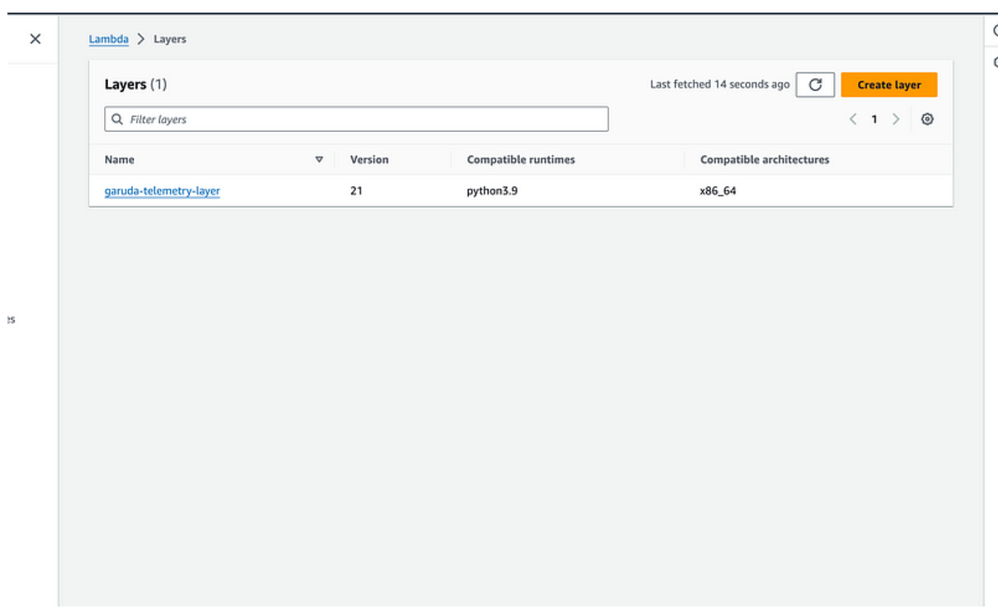
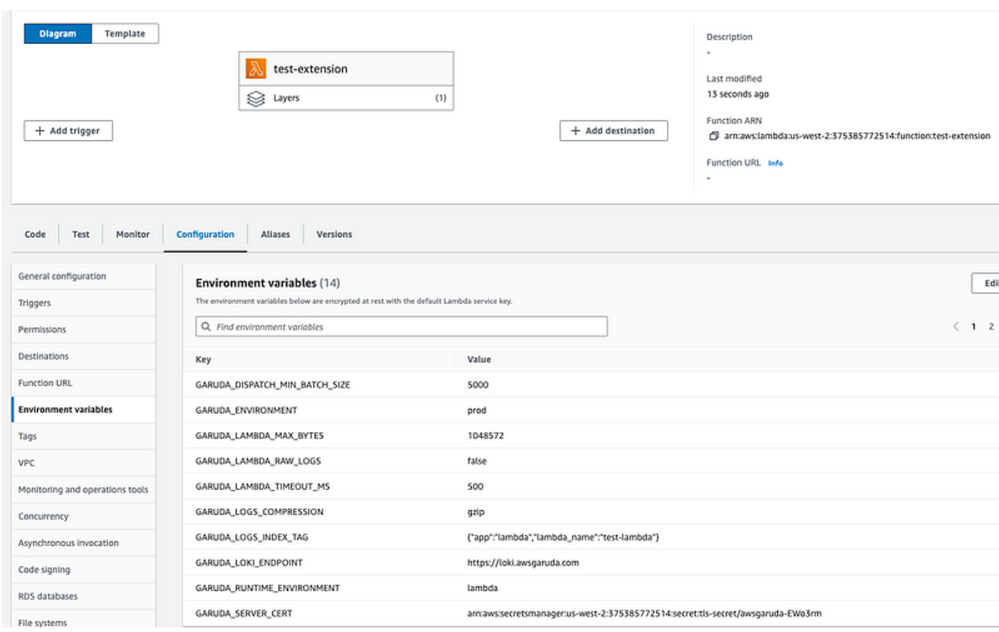
- The Solution: To bridge this gap, the Lambda extension for Garuda was born. This custom connector empowers the seamless integration of AWS Lambda logs with Garuda’s observability stack, ensuring that serverless workloads remain fully observable within the Garuda ecosystem.
- Garuda SDK: Empowering Seamless Integration
- The Need: While exploring open-source solutions, it became apparent that existing SDKs for Grafana, Mimir, and Loki were either outdated or lacked essential features. Moreover, multi-tenant support was notably absent.
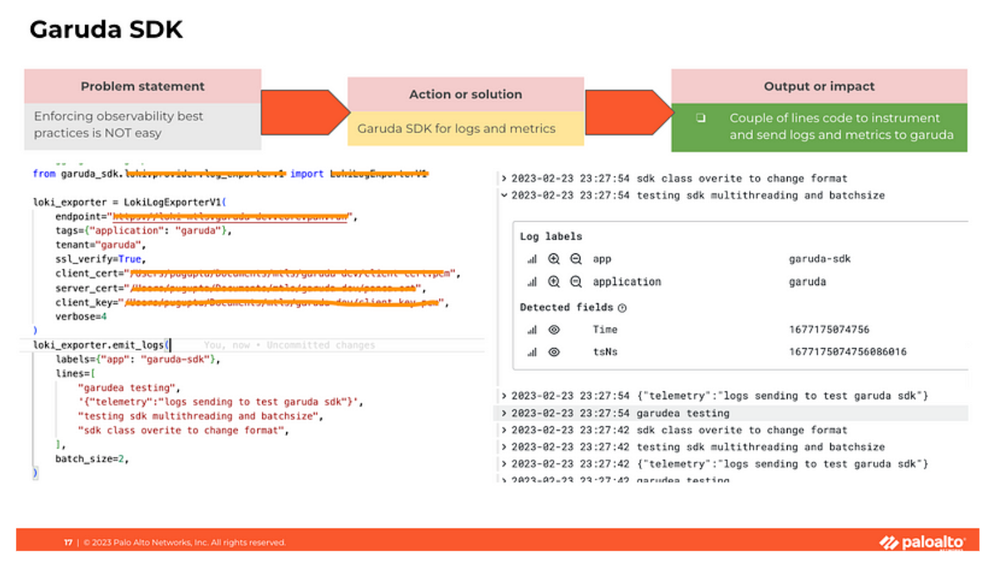
- The Solution: Enter the Garuda SDK — a comprehensive toolkit designed to empower developers in seamlessly integrating their applications with Garuda’s observability stack. the Garuda SDK simplifies the instrumentation process and accelerates the adoption of observability best practices across diverse environments.
- Garuda Lib: Centralizing Client-Side Logic
- The Need: As Garuda’s ecosystem expanded, the proliferation of disparate client-side logic threatened to complicate matters and hinder scalability. There was a pressing need to centralize client-related logic for interacting with Garuda’s backend services.
- The Solution: Thus, Garuda Lib emerged as a pivotal tool for centralizing and simplifying client-side logic. By encapsulating client-related logic and providing a unified interface for interacting with Garuda’s custom services, Garuda Lib empowers developers to navigate the intricacies of Garuda’s ecosystem with unparalleled ease and agility.
- Garuda CLI: Enabling Seamless Interaction
- The Need: With the advent of the Gitlab pipeline, a new requirement emerged: the need for an SDK that enables direct metric and log submission from GitLab pipelines, job executions, or short-lived jobs.
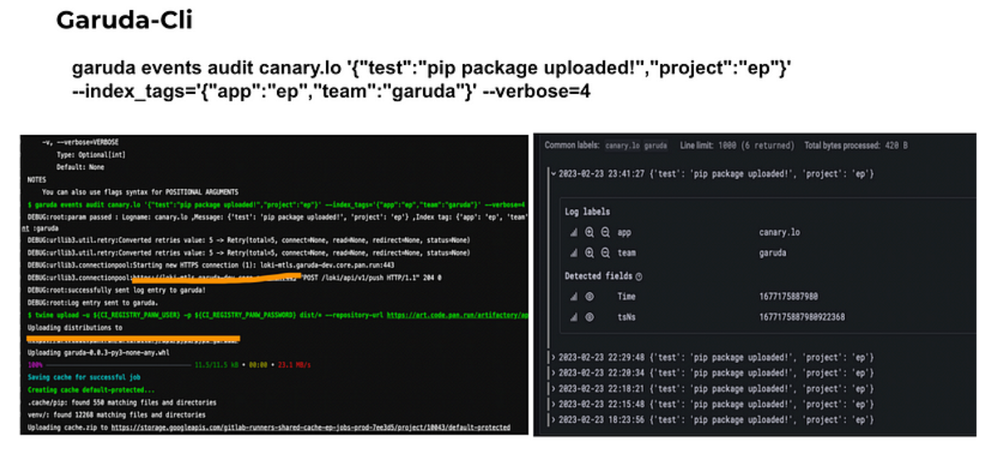
- The Solution: To address this need, the Garuda CLI was developed. Leveraging the Garuda SDK’s capabilities, this command-line interface allows seamless submission of metrics and logs directly from shell scripts, ensuring efficient integration with Garuda’s observability stack.
In summary, the development of custom connectors in Garuda arose from the necessity of addressing critical gaps in the observability landscape. From filling AWS Lambda observability gaps to empowering seamless integration and centralizing client-side logic, each custom connector plays a pivotal role in Garuda’s journey toward comprehensive observability.
Types of Custom Connectors in Garuda:
- Garuda SDK: Empowering Developers
- The Garuda SDK stands as a powerful toolkit currently undergoing optimization across various Garuda services.
- Designed to facilitate the creation of custom metrics, capture GitLab pipeline logs, support Garuda’s cost service, and much more.
- By integrating seamlessly with existing codebases, the Garuda SDK accelerates the adoption of observability best practices with minimal developer effort.
- Lambda Extension: Extending Serverless Monitoring
- Serverless architectures pose unique observability challenges due to their ephemeral nature.
- The Lambda extension addresses this by capturing performance logs from Lambda functions, ensuring comprehensive monitoring within Garuda.
- This enables organizations to effectively monitor and optimize their serverless workloads, enhancing operational efficiency.
- Garuda Lib: Simplifying Integration Across Environments
- In heterogeneous environments comprising Kubernetes clusters, VMs, and cloud-native platforms, achieving consistent observability can be daunting.
- Garuda Lib serves as a lightweight library utilized in various Garuda services, including operators and cardinality APIs.
- By abstracting complexities, it simplifies data collection and instrumentation, ensuring consistent observability across the infrastructure stack.
- Widely employed by customers for tasks like fetching logs for debugging and integrating with remediation platforms, Garuda Lib streamlines observability across diverse environments.
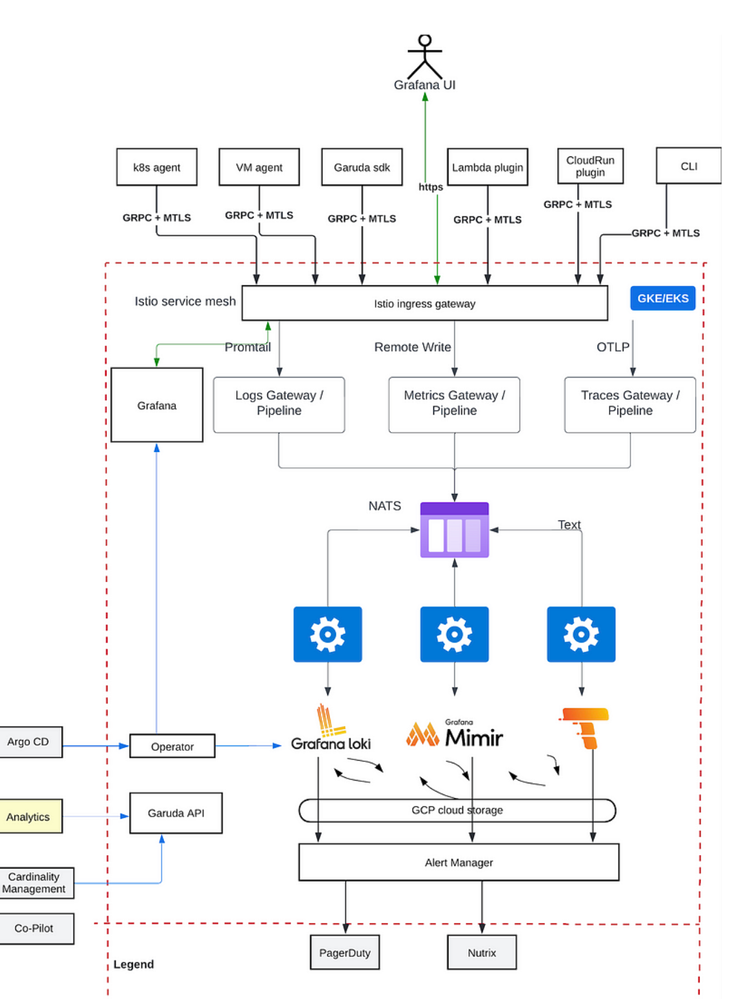
Additionally, we’ve built a robust Garuda pipeline with advanced queuing capabilities. This pipeline serves as a crucial safety measure, ensuring data integrity even if components like Mimir, Loki, or Tempo encounter issues. While connectors like the Lambda extension, SDK, and CLI facilitate data collection, they don’t directly push data to Mimir, Loki, or Tempo. Instead, they interact with our Garuda pipeline, which acts as an intermediary layer. This design choice helps prevent data loss due to intermittent failures within the Grafana stack. For further insights into our decision to develop this pipeline instead of pushing data directly, check out this blog.
Impact of Custom Connectors:
- Enhanced Observability Coverage: By leveraging custom connectors, organizations can capture observability data from a wide range of sources, including applications, infrastructure, and cloud services.
- Accelerated Adoption: The availability of custom connectors simplifies the process of instrumenting applications for observability, accelerating adoption among development teams.
- Improved Troubleshooting: With comprehensive observability coverage, organizations can quickly diagnose and resolve issues, minimizing downtime and optimizing system performance.
Conclusion
Custom connectors play a pivotal role in extending Garuda’s observability capabilities, enabling organizations to achieve greater insights into their systems’ behavior and performance. By empowering developers, extending monitoring to serverless environments, and simplifying integration across diverse infrastructures, custom connectors lay the foundation for a robust observability solution. As organizations continue to embrace observability best practices, custom connectors will remain indispensable tools for achieving comprehensive and actionable insights into modern software systems.
The observability platform team at Palo Alto Networks:
Thanks for reading!
- 4843 Views
- 0 comments
- 2 Likes
-
AI
1 -
AI Engineering
1 -
Artificial Intelligence
1 -
auto-remediation
1 -
Backstage
1 -
Best Practices
1 -
Cardinality
1 -
Chatbot
1 -
Cortex
1 -
Cortex Data Lake
1 -
Cost Optimization
1 -
engineering
1 -
Engineering Blog
1 -
Enterprise AI
1 -
Garuda
2 -
Grafana
2 -
Guidance and Guidelines
1 -
IDP
1 -
Information Retrieval
1 -
Knowledge Management
1 -
Kubernetes
1 -
Langchain
1 -
LLM
1 -
Logs
1 -
Logwatch
1 -
Machine Learning
1 -
metrics
1 -
monitoring
1 -
Natural Language Processing
1 -
NLP
1 -
Observability
2 -
Palo Alto Networks
1 -
Python
1 -
Quick-Guide
1 -
RAG
1 -
RestAPI
1 -
Retrieval-Augmented Generation
1 -
Strata Logging Service
1 -
Streamlit
1 -
Synonyms
1
- Previous
- Next
- From Log Chaos to Intelligence: How LogWatch Agent Revolutionises Operational Analysis in Community Blogs
- Building an IDP with Backstage and Kubernetes: A Comprehensive Guide (Part 1) in Engineering Blogs
- Unlocking Service Reliability: Exploring SLO as a Service (SLOaaS) with Garuda Platform in Community Blogs
- Empowering Garuda: Unveiling a Unified API Layer with Cardinality Insights for Comprehensive Observability in Engineering Blogs


