- Access exclusive content
- Connect with peers
- Share your expertise
- Find support resources
Click Preferences to customize your cookie settings.
Unlock your full community experience!
Network monitor shows huge traffic spike, but can't find traffic details
- LIVEcommunity
- Discussions
- Network Security
- Next-Generation Firewall Discussions
- Network monitor shows huge traffic spike, but can't find traffic details
- Subscribe to RSS Feed
- Mark Topic as New
- Mark Topic as Read
- Float this Topic for Current User
- Printer Friendly Page
Network monitor shows huge traffic spike, but can't find traffic details
- Mark as New
- Subscribe to RSS Feed
- Permalink
09-13-2023 04:38 PM
Hey folks.
I had a situation today whereby one of my PA's was responding really slowly across IPSec tunnels and for Global protect clients - so once I could get onto it I started digging into the network monitor to see if I could find out if there was a link/network load issue.
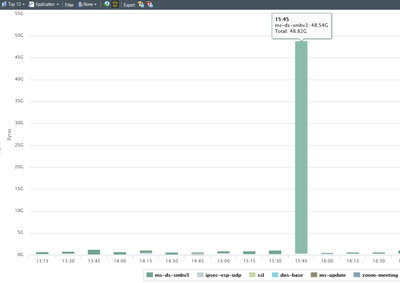
I found a huge spike in traffic in the period concerned - much, much more than normal - but when I tried to check the traffic logs for matching application type, I can;t find anything which would come even close to matching this level of load
The above shows the spike from the traffic monitor - you can see the increase plainly - and it lists as ms-ds-smbv3 - but when I go looking for that app in the traffic logs - there's minimal amounts - and none of it is in the period indicated by the network traffic monitor.
Does anyone know where I can dig to try and find out where this traffic was from/to?
Thanks
- Mark as New
- Subscribe to RSS Feed
- Permalink
09-18-2023 06:58 AM
Hi @darren_g ,
Note that traffic log will be generated at the session end (by default) so if you filter your logs with timeframe you will be looking at the timeframe when the log was created. You may need to filter based on session start - which is available field in the log entry.
Also look at the amount of total bytes (column that summarize the sent and receive). You may also try to apply filter to should only logs for SMB app that has total bytes greater than X
- 2958 Views
- 1 replies
- 0 Likes
Show your appreciation!
Click Accept as Solution to acknowledge that the answer to your question has been provided.
The button appears next to the replies on topics you’ve started. The member who gave the solution and all future visitors to this topic will appreciate it!
These simple actions take just seconds of your time, but go a long way in showing appreciation for community members and the LIVEcommunity as a whole!
The LIVEcommunity thanks you for your participation!
- Palo Windows ARP Issue - Windows Hosts Not Installing ARP info in Next-Generation Firewall Discussions
- Palo Alto 3410 Firewall 100% DP CPU spike in Next-Generation Firewall Discussions
- traffic disruption on routing change in Next-Generation Firewall Discussions
- Prisma browser extension for Google Chrome does not auto or force sign in in Prisma Access Agent Discussions
- Restrict access via GlobalProtect to permit access to only a specific Google Drive Account/Folder in GlobalProtect Discussions


