- Access exclusive content
- Connect with peers
- Share your expertise
- Find support resources
Click Preferences to customize your cookie settings.
Unlock your full community experience!
Wildfire Submission Logs on Prisma Access
- LIVEcommunity
- Products
- Secure Access Service Edge
- Prisma Access
- Prisma Access Articles
- Wildfire Submission Logs on Prisma Access
- Subscribe to RSS Feed
- Mark as New
- Mark as Read
- Printer Friendly Page
- Mark as New
- Subscribe to RSS Feed
- Permalink
on 11-22-2021 12:17 PM - edited on 11-22-2021 12:21 PM by jforsythe
The following article walks through the steps to verify the WildFire submission logs for Prisma Access deployment via the Panorama and Explore application on the hub.
Panorama
- To view samples submitted by a firewall to a WildFire public, private, or hybrid cloud, select Monitor > Logs > WildFire Submissions.
- Select the Device Group related to the Prisma Access tenant of interest.
- When WildFire analysis of a sample is complete, the results are accessible in the WildFire Submissions logs. The submission logs include details about a given sample, including the following information:
- The Verdict column indicates whether the sample is benign, malicious, phishing, or grayware.
- The Action column indicates whether the firewall allowed or blocked the sample.
- The Severity column indicates how much of a threat a sample poses to an organization using the following values: critical, high, medium, low, and informational.
Information on different kinds of verdicts can be found here.
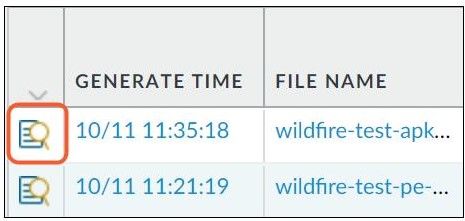
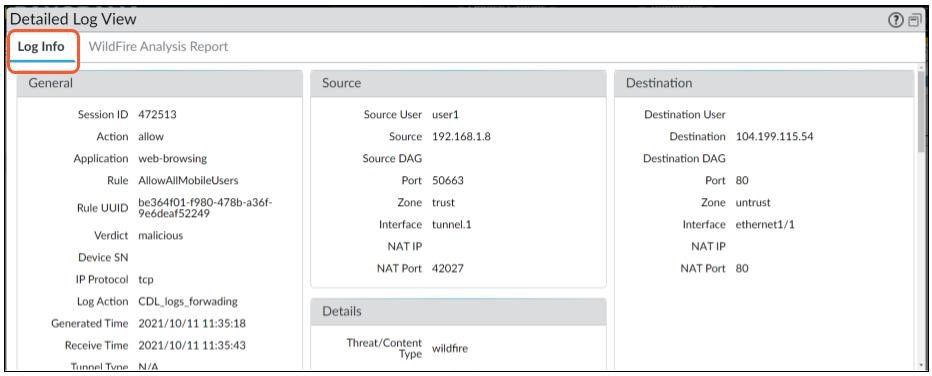
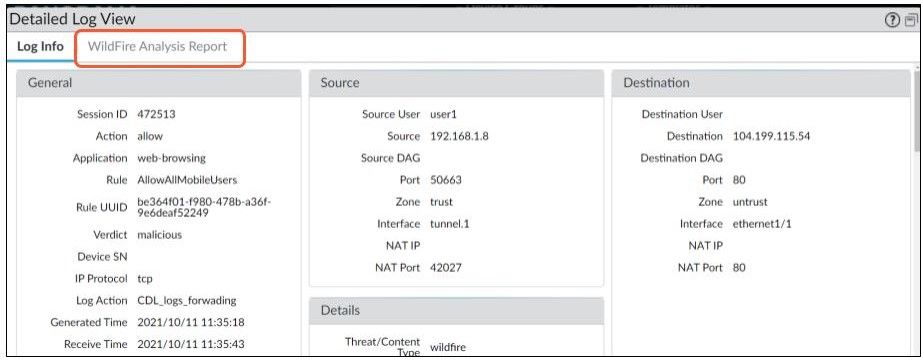
- For an entry, select the Log Details icon to open a detailed log view for each entry:
- Log Info provides details around the wildfire that shared the suspicious file and triggered the wildfire submission
- For all samples, the WildFire analysis report displays file and session details. For malware samples, the WildFire analysis report is extended to include details on the file attributes and behavior that indicates the file was malicious.
Explore App
To access the explore app, one must login into the hub. The Explore app is available for free for all customers. A complete guide to the Explore app can be found here.
The following are steps to see wildfire submission logs via Explore app.
- Select the Explore app from the list of activated apps on the hub
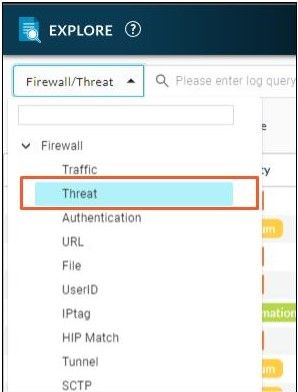
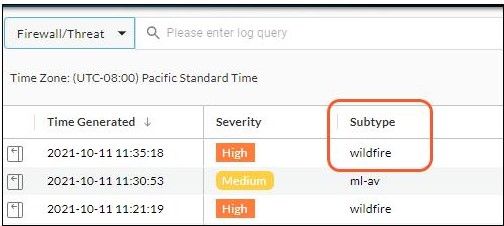
- Select Threat logs from the log type selection
- Subtype wildfire represents the logs represent the results of WildFire analysis:
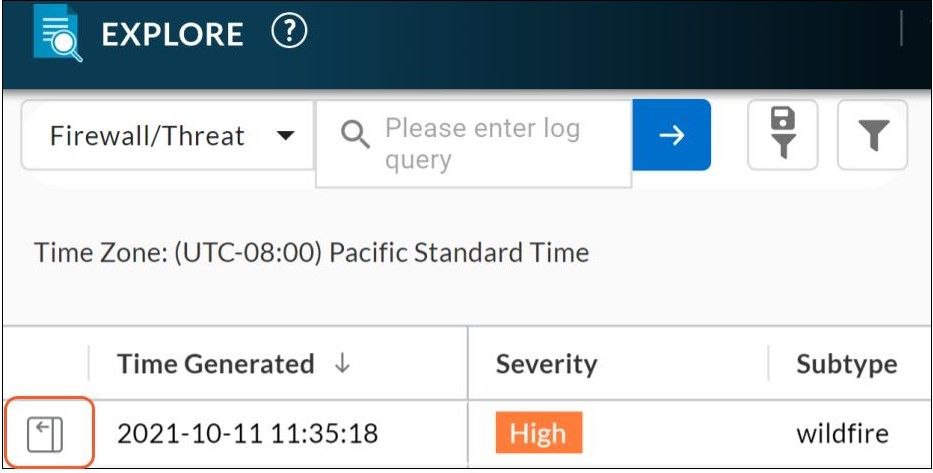
- Click on the ‘Details' view option to look into log details:
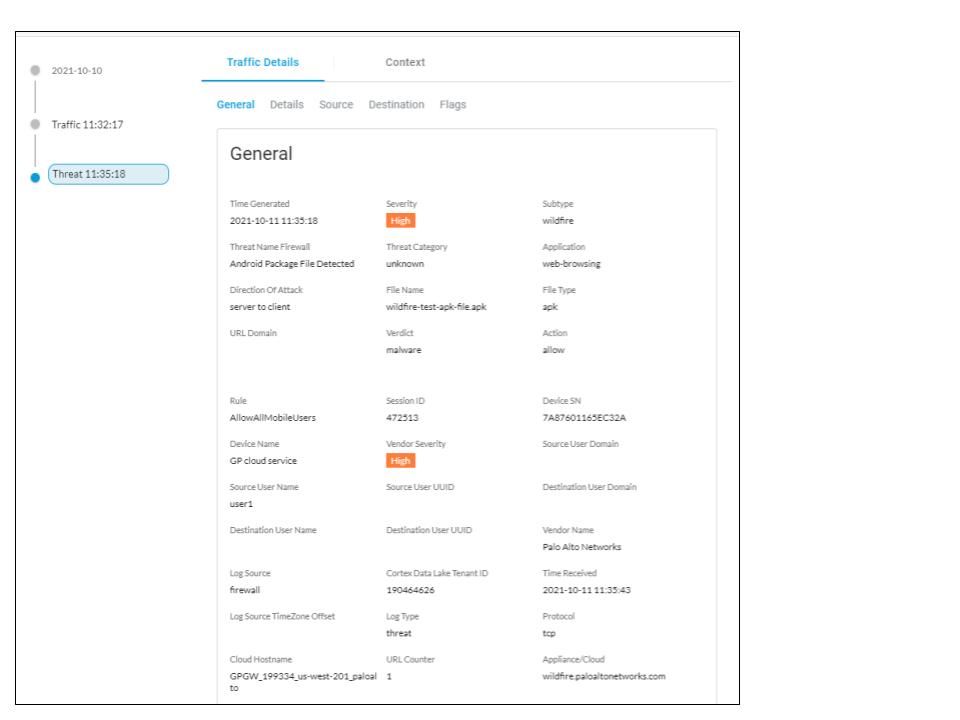
- The ‘Details’ view will provide information on the traffic and threat details. ‘General’ will provide traffic information and threat details
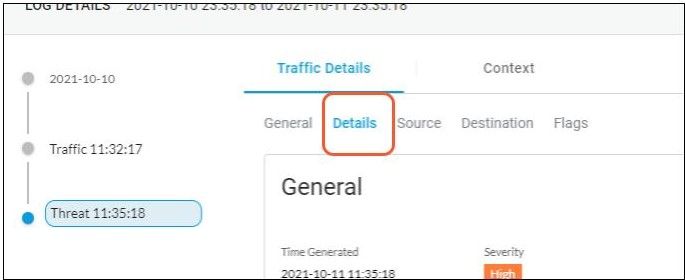
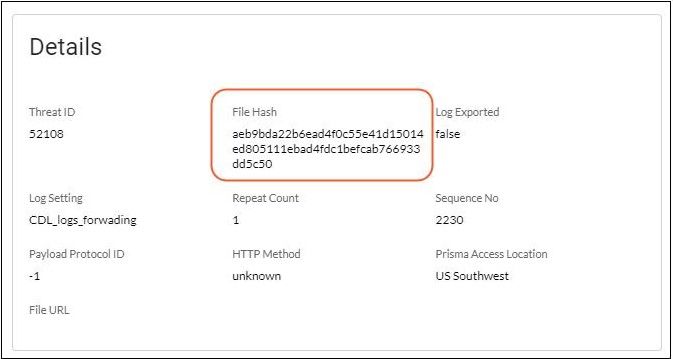
- Click on the ‘Details’ tab to get the hash of the file that triggered the wildfire.
- Copy the file hash from the screen
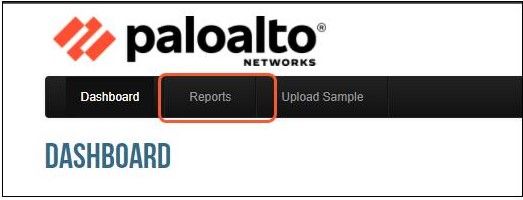
- Login into WildFire Portal and select Reports
- Search using the file hash
- Click on the ‘Details’ button to open the report in the new tab
Which region will the WF cloud service sent by Prisma Access ?
Reports cannot be viewed on global portal configured with template
I was able to confirm this on another portal.
How do Prisma Access decide on a destination?
If you know, please let me know.
According to the PDF at the following URL, it is determined by the Compute Location of Prisma Access.
https://www.paloaltonetworks.com/resources/datasheets/privacy-prisma-access
- 6557 Views
- 3 comments
- 1 Likes


