- Access exclusive content
- Connect with peers
- Share your expertise
- Find support resources
Click Preferences to customize your cookie settings.
Unlock your full community experience!
Cortex XDR dashboard into Grafana?
- LIVEcommunity
- Discussions
- Security Operations
- Cortex XDR Discussions
- Cortex XDR dashboard into Grafana?
- Subscribe to RSS Feed
- Mark Topic as New
- Mark Topic as Read
- Float this Topic for Current User
- Printer Friendly Page
- Mark as New
- Subscribe to RSS Feed
- Permalink
04-08-2024 11:03 PM

am 04-08-2024 11:02 AM
Hello, I don't know if I'm in the right place...
I would like to integrate our Cortex XDR dashboard into Grafana. I know this is possible via an API, but which connection do I choose in Grafana? 'Websocket API'? Which data connection in Grafana do I need?
Have somebody already done that? Are there instructions for this?
Basically I would like to create a dashboard in Grafana that shows the incidents from XDR.
It would be nice if someone could help me. Thanks.
Accepted Solutions
- Mark as New
- Subscribe to RSS Feed
- Permalink
04-12-2024 01:32 PM
Hi J.JohnsonRock,
For better security, we generally recommend setting the Cortex XDR API to Advanced to prevent replay attacks. However, the Advanced API key does not support cURL but it is suitable with scripts.
As outlined in the Get Started with APIs • Cortex XDR API Reference • Reader • Palo Alto Networks documentation portal,...here is a Standard Key cURL Example:
curl -X POST https://api-{fqdn}/public_api/v1/{name of api}/{name of call}/
-H "x-xdr-auth-id:{key_id}"
-H "Authorization:{key}"
-H "Content-Type:application/json"
-d '{}'
Advanced Key Python 3 Example
import requests
from datetime import datetime, timezone
import secrets
import string
import hashlib
import requests
def test_advanced_authentication(api_key_id, api_key):
# Generate a 64 bytes random string
nonce = "".join([secrets.choice(string.ascii_letters + string.digits) for _ in range(64)])
# Get the current timestamp as milliseconds.
timestamp = int(datetime.now(timezone.utc).timestamp()) * 1000
# Generate the auth key:
auth_key = "%s%s%s" % (api_key, nonce, timestamp)
# Convert to bytes object
auth_key = auth_key.encode("utf-8")
# Calculate sha256:
api_key_hash = hashlib.sha256(auth_key).hexdigest()
# Generate HTTP call headers
headers = {
"x-xdr-timestamp": str(timestamp),
"x-xdr-nonce": nonce,
"x-xdr-auth-id": str(api_key_id),
"Authorization": api_key_hash
}
parameters = {}
res = requests.post(url="https://api-{fqdn}/public_api/v1/{name of api}/{name of call}",
headers=headers,
json=parameters)
return res
Also, I suggest contacting Grafana support for assistance with their plugin.
Thanks
- Mark as New
- Subscribe to RSS Feed
- Permalink
04-10-2024 08:33 AM
Hi J.JohnsonRock,
curl -X POST https://api-{fqdn}/public_api/v1/{name of api}/{name of call}/ -H "x-xdr-auth-id:{key_id}" -H "Authorization:{key}" -H "Content-Type:application/json" -d '{}'
Here is a video walkthrough of the process Public API Cortex XDR 2.0 | Palo Alto Networks
If you found this answer helpful, please select Accept as Solution.
Thank you
- Mark as New
- Subscribe to RSS Feed
- Permalink
04-12-2024 04:26 AM
Thank you for your guidance. I created the API token exactly as explained in the video and it worked well.
In Grafana under "Data Sources" I tried to connect with the "Infinity" plugin, but without success.
The message always comes up: "error getting data frame. requested URL is not allowed. To allow this URL, update the datasource config Security -> Allowed Hosts section"
No matter what I set.
I don't know if I'm setting something up incorrectly in the "Infinity Plugin" under Authentication or "Auth type"
Can you tell me which auth type I have to choose?
Or maybe instructions or a screenshot??
- Mark as New
- Subscribe to RSS Feed
- Permalink
04-12-2024 01:32 PM
Hi J.JohnsonRock,
For better security, we generally recommend setting the Cortex XDR API to Advanced to prevent replay attacks. However, the Advanced API key does not support cURL but it is suitable with scripts.
As outlined in the Get Started with APIs • Cortex XDR API Reference • Reader • Palo Alto Networks documentation portal,...here is a Standard Key cURL Example:
curl -X POST https://api-{fqdn}/public_api/v1/{name of api}/{name of call}/
-H "x-xdr-auth-id:{key_id}"
-H "Authorization:{key}"
-H "Content-Type:application/json"
-d '{}'
Advanced Key Python 3 Example
import requests
from datetime import datetime, timezone
import secrets
import string
import hashlib
import requests
def test_advanced_authentication(api_key_id, api_key):
# Generate a 64 bytes random string
nonce = "".join([secrets.choice(string.ascii_letters + string.digits) for _ in range(64)])
# Get the current timestamp as milliseconds.
timestamp = int(datetime.now(timezone.utc).timestamp()) * 1000
# Generate the auth key:
auth_key = "%s%s%s" % (api_key, nonce, timestamp)
# Convert to bytes object
auth_key = auth_key.encode("utf-8")
# Calculate sha256:
api_key_hash = hashlib.sha256(auth_key).hexdigest()
# Generate HTTP call headers
headers = {
"x-xdr-timestamp": str(timestamp),
"x-xdr-nonce": nonce,
"x-xdr-auth-id": str(api_key_id),
"Authorization": api_key_hash
}
parameters = {}
res = requests.post(url="https://api-{fqdn}/public_api/v1/{name of api}/{name of call}",
headers=headers,
json=parameters)
return res
Also, I suggest contacting Grafana support for assistance with their plugin.
Thanks
- Mark as New
- Subscribe to RSS Feed
- Permalink
04-16-2024 05:23 AM
Good day,
Thank you very much for the detailed description.
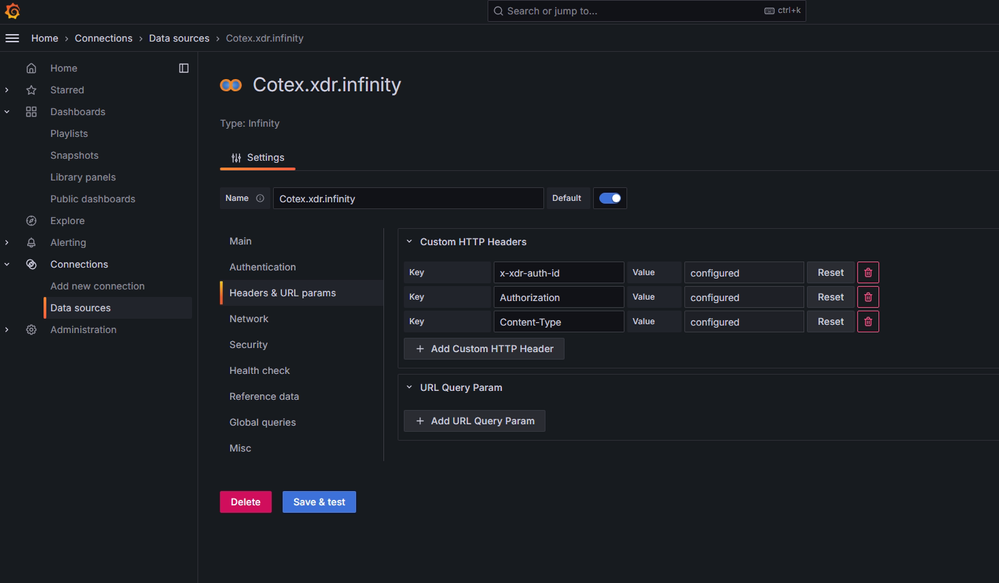
I have now created a "standard token" for testing and, following your instructions, created the connection to the Grafana data source "infinitiy" (see picture)

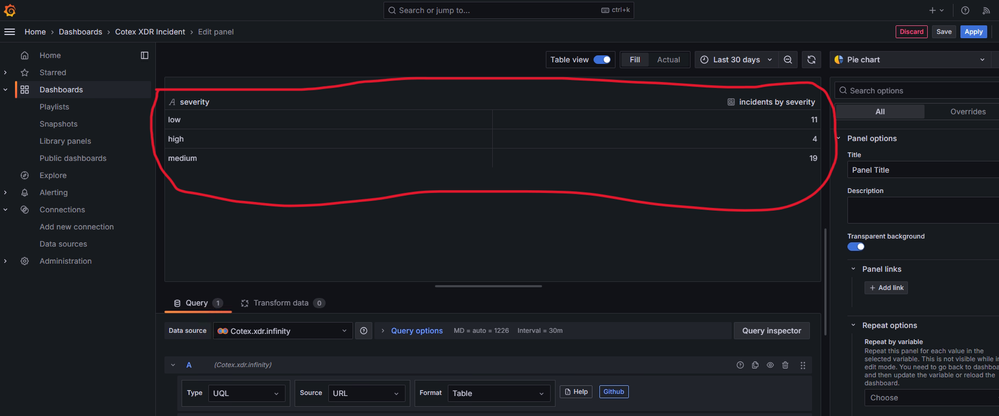
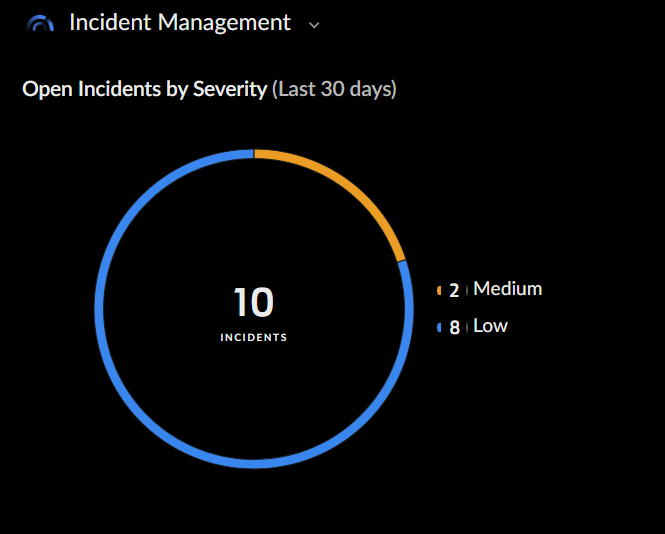
Now I have a question: which post URL do I need so that I can only display the last "Open Incidents by Severity (Last 30 days)"?
I currently see all incidents in Grafana >including those I have marked as completed (I don't want to display them)

Eigentlich so wie in Cortex Dashboard "Open Incidents by Severity Last 30 days: 
Do you understand what I mean?
Can you help me there?
- Mark as New
- Subscribe to RSS Feed
- Permalink
04-16-2024 07:28 AM - edited 04-16-2024 07:29 AM
Good morning,
That is an OOTB widget, so you will need to create an XQL query to create the pie chart. Please note that using the XQL API consumes your daily free quota of query units. Each XQL Query consumes query units based on the number of responses from the API results. Queries called without enough quota will fail. Additional units can be purchased through your account team.
Here is an XQL query to get started:
config case_sensitive = false timeframe = 30d
|dataset = incidents_assets
| fields incident_id, agent_id
| join type = left (dataset = alerts | filter excluded = FALSE and host_name != null | dedup incident_id, host_name | fields host_name, endpoint_id, incident_id, alert_arrival_timestamp, original_tags, alert_source ) as join_alerts join_alerts.incident_id = incident_id
| join type = left (dataset = scheduled_endpoints_dataset ) as endpoint_id endpoint_id.endpoint_id = endpoint_id
| join type = left (dataset = incidents | fields incident_id, severity, status ) as join_incidents join_incidents.incident_id = incident_id
| filter status in(ENUM.NEW, ENUM.UNDER_INVESTIGATION)
| comp count_distinct(incident_id ) as Incidents by severity
|
view graph type = pie header = "Open Incidents by Severity" xaxis = severity yaxis = Incidents valuecolor("LOW","#3f8aff") valuecolor("MEDIUM","#ffb43e") valuecolor("HIGH","rgba(255,0,0,0.99)")
The instructions are outlined in this Live Community webinar LIVEcommunity - On-Demand Webinar: "How To Use XQL APIs With Cortex XDR" - LIVEcommunity - 459696 (p...
The following is a request example to help you build your query based on the information generated.
- Take note of the required parameters
- URI /public_api/v1/xql/start_xql_query/
HTTP Method POST - Required License Cortex XDR Pro per Endpoint or Cortex XDR Pro per TB
- URI /public_api/v1/xql/start_xql_query/
Sample
curl -X POST https://api-{fqdn}/public_api/v1/xql/start_xql_query/ \
-H "x-xdr-auth-id:{key_id}" \
-H "Authorization:{key}" \
-H "Content-Type:application/json" \
-d '{
"request_data": {
"query": "dataset=xdr_data | fields event_id, event_type, event_sub_type | limit 3",
"tenants": ["tenantID", "tenantID"],
"timeframe": {"from": 1598907600000, "to": 1599080399000}
}
}'
Also, if you are unfamiliar with XQL, training is provided in Live Community as well as Beacon.
LIVEcommunity - Cortex XDR Basic XQL Crash Course - LIVEcommunity - 544056 (paloaltonetworks.com)
Thank you
- Mark as New
- Subscribe to RSS Feed
- Permalink
04-19-2024 12:13 AM
Hello, that sounds very interesting but also complicated.
How many queries per day is normal or allowed?
Can't I do this with Grafana using the normal API?
- Mark as New
- Subscribe to RSS Feed
- Permalink
04-19-2024 12:21 PM
The query size/CU usage is dependent upon the query and the customers environment.
I am not a Grafana SME and provided the options available in Cortex XDR.
- Mark as New
- Subscribe to RSS Feed
- Permalink
04-23-2024 11:22 PM
Good morning,
I created my dashboard as requested using the “Infinity” plugin. Therefore I no longer need the “XQL” variant.

Best regards
- Mark as New
- Subscribe to RSS Feed
- Permalink
04-24-2024 06:16 AM
Good Morning JJohnsonRock,
Look great!
- 1 accepted solution
- 6368 Views
- 9 replies
- 1 Likes
Show your appreciation!
Click Accept as Solution to acknowledge that the answer to your question has been provided.
The button appears next to the replies on topics you’ve started. The member who gave the solution and all future visitors to this topic will appreciate it!
These simple actions take just seconds of your time, but go a long way in showing appreciation for community members and the LIVEcommunity as a whole!
The LIVEcommunity thanks you for your participation!
- Cortex Assets Report without agent installed in Cortex XDR Discussions
- We are experiencing a problem, data may not be up to date. Please try again in a few minutes. in Cortex XDR Discussions
- SHOW ALL ALERT in Cortex XDR Discussions
- Create custom widget to display data from Jamf in Cortex XDR Discussions
- Cortex XDR installation on GKE AutoPilot cluster in Cortex XDR Discussions


