- Access exclusive content
- Connect with peers
- Share your expertise
- Find support resources
Click Preferences to customize your cookie settings.
Unlock your full community experience!
reportd process function
- LIVEcommunity
- Discussions
- General Topics
- reportd process function
- Subscribe to RSS Feed
- Mark Topic as New
- Mark Topic as Read
- Float this Topic for Current User
- Printer Friendly Page
- Mark as New
- Subscribe to RSS Feed
- Permalink
10-08-2020 05:26 AM - edited 10-08-2020 05:27 AM
Anyone have some knowledge on what the reportd system process does? Doing a "show system resources follow" from Panorama shows high utilization of this process. I assumed reportd might be related to custom reports, we have 17 "scheduled" custom reports, but I can't find how to see when those reports are scheduled to be running.
Accepted Solutions
- Mark as New
- Subscribe to RSS Feed
- Permalink
10-08-2020 07:01 PM
reportd does the log queries alongside reports, and I know it interacts a bit with the Data Lake process.
What version of PAN-OS are you running at the moment? There's a number of bug fixes which address issues with reportd depending on your current release.
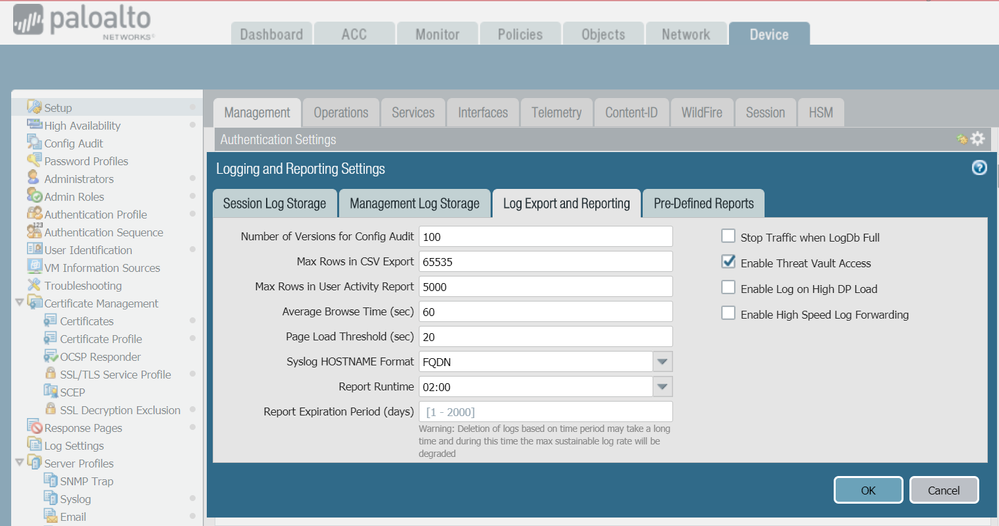
As for your scheduling question, go to the Device tab, and under management click on the settings icon on Logging And Reporting Settings. On the box that opens up, you'll want to navigate to the Log Export and Reporting tab and there's an option for Report Runtime.
- Mark as New
- Subscribe to RSS Feed
- Permalink
10-27-2020 06:21 AM
I have an update on reportd. After working with Palo Alto Support. It was identified that the "Pre-Defined Reports" of our managed firewalls were the cause of our high reportd cpu time and slowness in Panorama GUI. We disabled the pre-defined reports in our templates of the managed firewalls, and no more high cpu time for reportd, better responsiveness from Panorama GUI. We saw a recurring hourly vm cpu spike, with the reports disabled for the managed firewalls, the recurring hourly cpu spike is no longer.
Here is an associated link from the knowledge base:
https://knowledgebase.paloaltonetworks.com/KCSArticleDetail?id=kA10g000000ClSvCAK
- Mark as New
- Subscribe to RSS Feed
- Permalink
10-08-2020 07:01 PM
reportd does the log queries alongside reports, and I know it interacts a bit with the Data Lake process.
What version of PAN-OS are you running at the moment? There's a number of bug fixes which address issues with reportd depending on your current release.
As for your scheduling question, go to the Device tab, and under management click on the settings icon on Logging And Reporting Settings. On the box that opens up, you'll want to navigate to the Log Export and Reporting tab and there's an option for Report Runtime.
- Mark as New
- Subscribe to RSS Feed
- Permalink
10-09-2020 02:51 AM
Awesome! Thanks for the info on reports. Running 8.1.15
- Mark as New
- Subscribe to RSS Feed
- Permalink
10-27-2020 06:21 AM
I have an update on reportd. After working with Palo Alto Support. It was identified that the "Pre-Defined Reports" of our managed firewalls were the cause of our high reportd cpu time and slowness in Panorama GUI. We disabled the pre-defined reports in our templates of the managed firewalls, and no more high cpu time for reportd, better responsiveness from Panorama GUI. We saw a recurring hourly vm cpu spike, with the reports disabled for the managed firewalls, the recurring hourly cpu spike is no longer.
Here is an associated link from the knowledge base:
https://knowledgebase.paloaltonetworks.com/KCSArticleDetail?id=kA10g000000ClSvCAK
- 2 accepted solutions
- 7231 Views
- 3 replies
- 0 Likes
Show your appreciation!
Click Accept as Solution to acknowledge that the answer to your question has been provided.
The button appears next to the replies on topics you’ve started. The member who gave the solution and all future visitors to this topic will appreciate it!
These simple actions take just seconds of your time, but go a long way in showing appreciation for community members and the LIVEcommunity as a whole!
The LIVEcommunity thanks you for your participation!
- No Traffic and Threats not visible in Panorama Monitor after upgrading in Panorama Discussions
- migrating from 5220 to 3440 - 40 G interface question in Next-Generation Firewall Discussions
- Duo SSO With GlobalProtect Client Connection Not Getting Established in General Topics
- Automatic review of Cortex XDR for Prevention Profile: Agent Settings, Malware and Exploit in Cortex XDR Discussions
- Python Script isn't being executed completely in Cortex XDR in Cortex XDR Discussions


