- Access exclusive content
- Connect with peers
- Share your expertise
- Find support resources
 Log Retention. Where did my logs go?
The LIVEcommunity dives into Log Retention and provides answers to some burning questions about old logs. Learn more about log retention and see how Cortex Data Lake comes to the rescue. Get answers on LIVEcommunity.
As you may or may not know, your device can only store so many logs. This is quite a popular topic. Some have asked questions about log retention: Where did my logs go? Why am I only seeing two days of logs? Are the older logs gone?
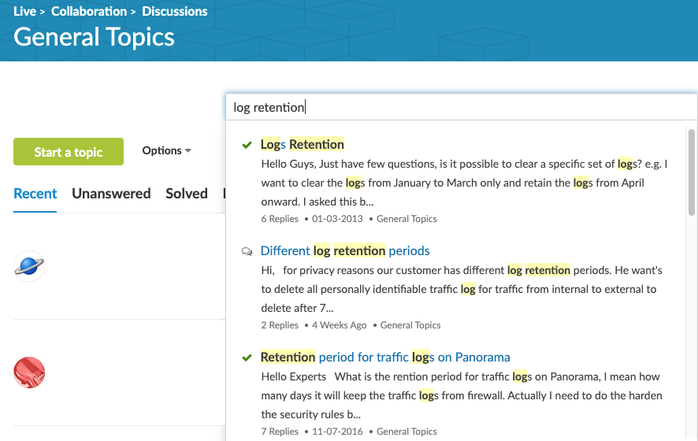
Well, your questions about Log Retention can be answered on LIVEcommunity. Here's how you can find more information:

Log retention is actually very simple. It all depends on how much you are logging in combination with how much space you have available. If you are logging EVERYTHING and keep all your logs locally on your firewall, then it's likely that you'll only have a couple of days worth of logs available—possibly even less.
If you have an M-100/M-200 or M-500/M-600 Panorama, then you can add more hard drives. If you have a virtual Panorama, you can allocate more log storage. In doing so, you can extend your log retention.
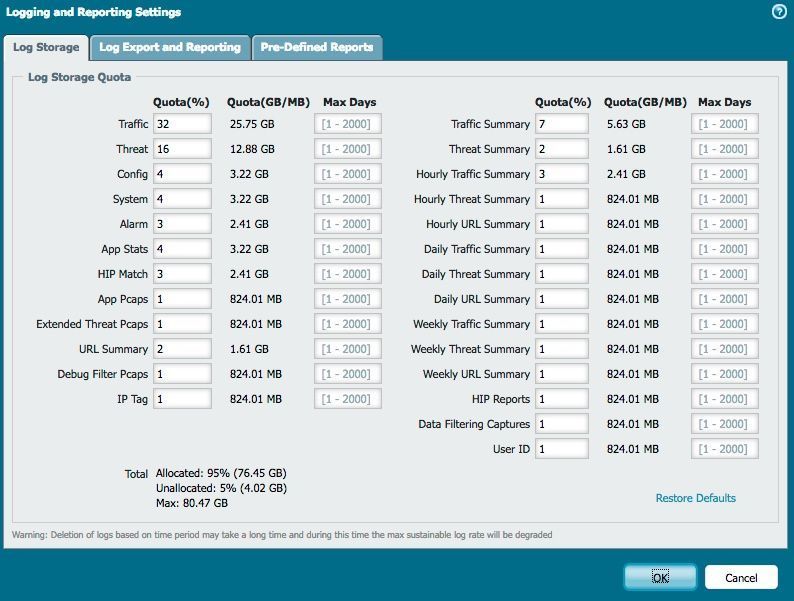
When you run out of space, the Palo Alto Networks firewall will automatically delete the oldest entries in that specific log. When you are limited to store your logs locally, you can adjust the reserved space for each type of log by going to Device > Setup > Management > Logging and Reporting Settings as seen in the screenshot below.

If you see a drastic change in log retention, a common reason might be that there's currently more traffic hitting a rule that is being logged. To retain the same log retention, you will need to adjust your storage allocation. That being said, it might also be a good idea to review what exactly you are logging. Is it really necessary to log at start AND end of a session? Do you really need all those internal (trusted) sessions logged?
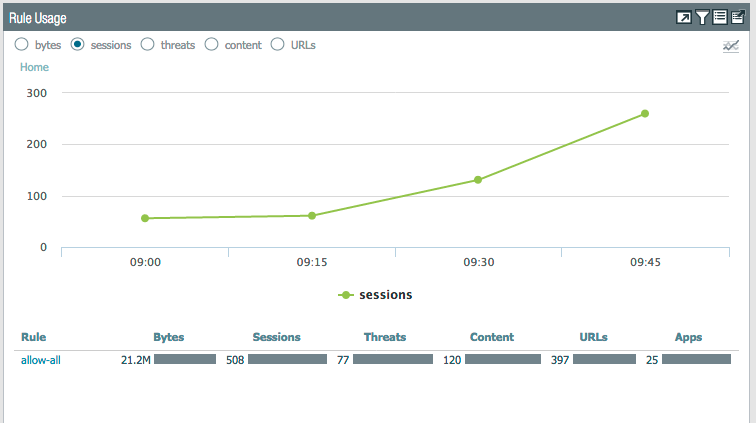
In the newer PAN-OS versions, there's a cool feature in ACC that allows you to see how many times a specific rule was hit over time. This makes it easier to troubleshoot a sudden decrease in log retention while searching for the rule that is eating up all your available log space.

Simply put, certain kind of security logs just need much longer retention than just a couple of days. With that in mind, it might even be a good idea to look into alternative log storage solutions when you are planning for long-term log retention. This is especially true when you have a very high log rate. Your local device will not be able to hold your logs for that long, but an M-100/M-200 or M-500/M-600 Panorama or a log collector might be the solution you need.
Very simply by using the following CLI command 'show system logdb-quota'. This will produce the current log retention for each type of log file on your local firewall. It might look something like this:
>show system logdb-quota

....

Disk usage:
traffic: Logs and Indexes: 26G Current Retention: 340 days
threat: Logs and Indexes: 3.0G Current Retention: 829 days
system: Logs and Indexes: 1.2G Current Retention: 731 days
config: Logs and Indexes: 1.2G Current Retention: 1007 days
trsum: Logs and Indexes: 3.7G Current Retention: 998 days
hourlytrsum: Logs and Indexes: 1.2G Current Retention: 998 days
dailytrsum: Logs and Indexes: 160M Current Retention: 998 days
weeklytrsum: Logs and Indexes: 76M Current Retention: 996 days
thsum: Logs and Indexes: 850M Current Retention: 998 days
hourlythsum: Logs and Indexes: 66M Current Retention: 998 days
dailythsum: Logs and Indexes: 21M Current Retention: 998 days
weeklythsum: Logs and Indexes: 7.2M Current Retention: 996 days
appstatdb: Logs and Indexes: 82M Current Retention: 1007 days
userid: Logs and Indexes: 46M Current Retention: 976 days
hipmatch: Logs and Indexes: 132K Current Retention: 916 days
extpcap: Logs and Indexes: 20K Current Retention: 0 days
urlsum: Logs and Indexes: 580M Current Retention: 342 days
hourlyurlsum: Logs and Indexes: 306M Current Retention: 342 days
dailyurlsum: Logs and Indexes: 26M Current Retention: 342 days
weeklyurlsum: Logs and Indexes: 9.1M Current Retention: 282 days
application: Logs and Indexes: 39M Current Retention: 959 days
filters: Logs and Indexes: 28M Current Retention: 621 days
dlp: Logs and Indexes: 20K Current Retention: 175 days
hip_report_base: Logs and Indexes: 1.6M Current Retention: N/A
wildfire: Logs and Indexes: 40K Current Retention: N/A
Palo Alto Networks Cortex Data Lake (previously called Logging Service) provides cloud-based logging for our security products, including our next-generation firewalls, Prisma Access (previously called GlobalProtect cloud service), and Traps management service. Cortex Data Lake lets you collect ever-expanding volumes of data without needing to plan for local compute and storage, and it is ready to scale from the start. Once you're sending logs to Cortex Data Lake, you can start leveraging Cortex apps that analyze and report on your network, cloud, and endpoint data.
This cloud-based logging infrastructure is available in two regions—the Americas and the European Union. Review the Cortex Data Lake privacy datasheet for details on how network data is captured, processed, and stored.
Please post any comments, suggestions, or questions you would like answered below!
But before doing that, you might want to check on the LIVEcommunity Blog and discussions,
Your question might have been answered already. Below is just a small set of log retention articles discussions that can help answer your questions as well.
Logs Retention - User Discussion
Log Retention - Second User Discussion
Retention period for traffic logs on Panorama - User Discussion
PA-3020 log retention period - User Discussion
Critical Panorama Alarm - Minimum Retention Period (Days) Violated for Segment
-Kiwi out!
You must be a registered user to add a comment. If you've already registered, sign in. Otherwise, register and sign in.
| Subject | Likes |
|---|---|
| 5 Likes | |
| 3 Likes | |
| 3 Likes | |
| 3 Likes | |
| 2 Likes |
| User | Likes Count |
|---|---|
| 12 | |
| 4 | |
| 3 | |
| 3 | |
| 2 |


