- Access exclusive content
- Connect with peers
- Share your expertise
- Find support resources
Click Preferences to customize your cookie settings.
Unlock your full community experience!
Find cause origin saturation interface
- LIVEcommunity
- Discussions
- General Topics
- Re: Find cause origin saturation interface
- Subscribe to RSS Feed
- Mark Topic as New
- Mark Topic as Read
- Float this Topic for Current User
- Printer Friendly Page
- Mark as New
- Subscribe to RSS Feed
- Permalink
10-23-2017 04:19 AM - edited 10-23-2017 04:50 AM

When we detect that a communications channel is saturated because someone or something is downloading a large file or occupying the entire bandwidth.
We do not know how to see in real time in the web interface of a PA-500 (firmware 7.1.6) that is happening.
It is only possible to see it once the communication has ended. That is, if I download a 100gb file. Until the file is downloaded
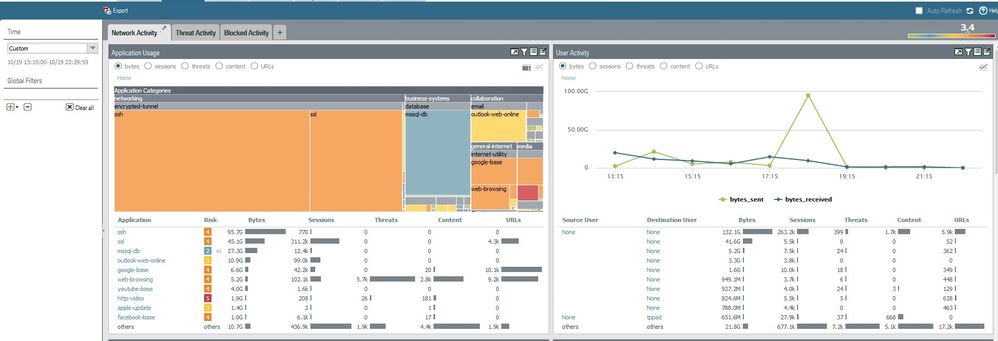
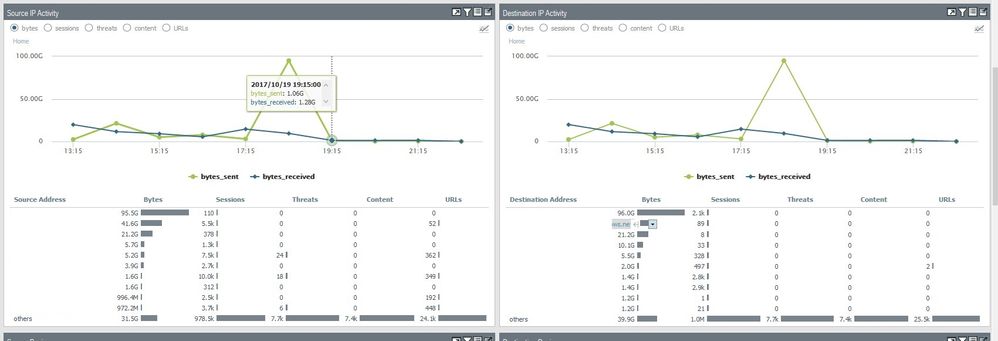
I tried it in it in the "Monitor / Traffic" tab or in the ACC / Network Activity / Last 15 minutes tab.
I know that exporting the traffic through netflow to a program that analyzes this type of traffic is possible to see it.
Is there any way to see it in Palo Alto, even if it is by the command line?
Our intention is to know who or what protocol is occupying the traffic at the time of detecting it.
Thank yo
Accepted Solutions
- Mark as New
- Subscribe to RSS Feed
- Permalink
10-23-2017 10:41 AM
ACC data is delayed by a bit. Its data comes from session logs, which only get recorded after the session has ended.
You can check the active sessions though, which will give you an idea of what's going on. It's available in the CLI and under Monitor > Session Browser. You won't be able to see only sessions over say 50GB, because the largest minimum size you can specify is 1GB.
In the Session Browser on the GUI, use this to see active sessions larger than 1 GB:
(min-kb eq '1000000')
Similarly, in the CLI, you can use:
show session all filter min-kb 1000000
- Mark as New
- Subscribe to RSS Feed
- Permalink
10-23-2017 01:09 PM
Hello,
Another option would be to use netflow. While you would have to setup a server for it, it will provide good details as to what you are looking for.
Regards,
- Mark as New
- Subscribe to RSS Feed
- Permalink
10-30-2017 11:45 AM
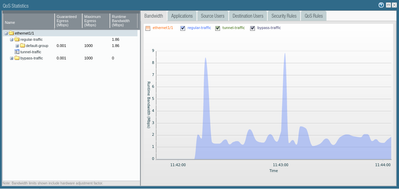
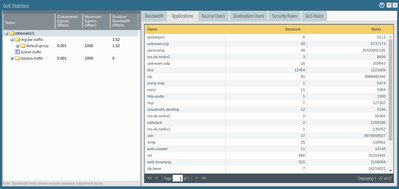
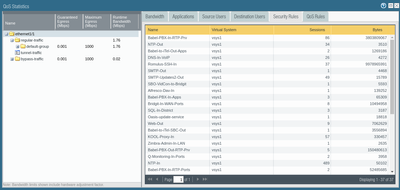
You can also enable QoS on a physical interface (you don't need to actually use it for anything, just enable it). This will then activate a Statistics link on the Network --> QoS page for that interface. If you click that link, you get a real-time view of the network traffic passing through that physical interface. And there are sub-tabs in that dialog that shows the Applications, Source/Destination Users, Security Policies, and QoS Policies that are generating the traffic. The data displayed is for the last 60 seconds worth of traffic, I believe.
- Mark as New
- Subscribe to RSS Feed
- Permalink
10-23-2017 10:41 AM
ACC data is delayed by a bit. Its data comes from session logs, which only get recorded after the session has ended.
You can check the active sessions though, which will give you an idea of what's going on. It's available in the CLI and under Monitor > Session Browser. You won't be able to see only sessions over say 50GB, because the largest minimum size you can specify is 1GB.
In the Session Browser on the GUI, use this to see active sessions larger than 1 GB:
(min-kb eq '1000000')
Similarly, in the CLI, you can use:
show session all filter min-kb 1000000
- Mark as New
- Subscribe to RSS Feed
- Permalink
10-23-2017 11:09 AM
One easy way to see live interface utilization is Chrome addon called pan(w)achrome
This can show when utilization is up and then use commands @gwesson provided to find session.
Also good idea to apply QoS.
Palo Alto Networks certified from 2011
- Mark as New
- Subscribe to RSS Feed
- Permalink
10-23-2017 11:46 AM
pan(w)achrome is really helpful in this situation and is something that can be easily monitored throughout the day to see if this is an actual issue, before you actually need to start monitoring through @gwesson commands.
The best Idea though is to follow @Raido_Rattameister's suggestion and apply QoS to this traffic to avoid the problem in the first place.
- Mark as New
- Subscribe to RSS Feed
- Permalink
10-23-2017 01:09 PM
Hello,
Another option would be to use netflow. While you would have to setup a server for it, it will provide good details as to what you are looking for.
Regards,
- Mark as New
- Subscribe to RSS Feed
- Permalink
10-30-2017 11:45 AM
You can also enable QoS on a physical interface (you don't need to actually use it for anything, just enable it). This will then activate a Statistics link on the Network --> QoS page for that interface. If you click that link, you get a real-time view of the network traffic passing through that physical interface. And there are sub-tabs in that dialog that shows the Applications, Source/Destination Users, Security Policies, and QoS Policies that are generating the traffic. The data displayed is for the last 60 seconds worth of traffic, I believe.
- 3 accepted solutions
- 7400 Views
- 6 replies
- 0 Likes
Show your appreciation!
Click Accept as Solution to acknowledge that the answer to your question has been provided.
The button appears next to the replies on topics you’ve started. The member who gave the solution and all future visitors to this topic will appreciate it!
These simple actions take just seconds of your time, but go a long way in showing appreciation for community members and the LIVEcommunity as a whole!
The LIVEcommunity thanks you for your participation!


