"No matching record" in ACC after initialy using the PA-device

cancel
Showing results for 
Show  only  | Search instead for 
Did you mean: 
Announcements
Please sign in to see details of an important advisory in our Customer Advisories area.

"No matching record" in ACC after initialy using the PA-device

L1 Bithead

Hi,


Today we start using the Palo Alto device.

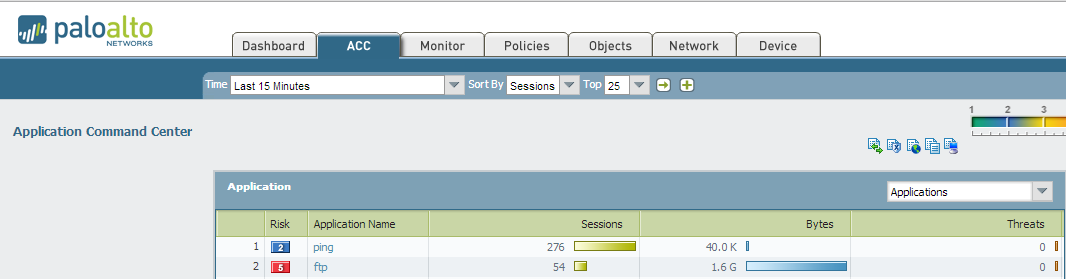
Being one of its beneficial features, the Application Command Center provides a quick Birdseye view upon network visibility.

Initially, we could drill down into (eg) Top Applications, in order to find out the top ip sources.

After some 6 hours, this fine grained information seems not to be available anymore in ACC. All Top Sources, Application, etc display "No matching record", except for the information about "Threat Prevention".

Regardless of the time interval being used as filter (15m, last 6 hours, ...)

Though, if I click the respective icon to switch from ACC into the monitor TAB for either Traffic or
Threat logs, the relevant log entries are available in here.

Do I miss a configuration setting, in order to restore full information availability via ACC?

Thanks

Kind regards,

Wim

1 accepted solution

Accepted Solutions

The main difference between "log on session start" and "log on session end" is:

- Session end will display traffic volume (total bytes).

- Session end will display the resulting AppID.

The volume thingy is pretty obvious but the resulting AppID thing means that for example if you visit facebook the actual identifications might be (not correct but as an example):

- unknown-tcp

- web-browsing

- ssl

- facebook (that is if you have ssl-termination in place)

The first three logs will be from "log on session start" while the forth will be from "log on session end".

A drawback with "on session end" is of course that the log post doesnt show up until the session really ends but on the other hand if you wish to keep number of logrows to a minimum "log on session end" will bring you more info than "log on session start".

So what one usually does is to enable "log on session end" for all security rules and "log on session start" on those you need to debug (and then turn off "log on session start" once the troubleshooting session is over).

A quickfix in your case would probably be to just clear all logs and start over but since you opened a case I think its best to wait until the support returns to you in case there is a bug somewhere which must be fixed in the PANOS (but also to get an answer of why your logging behaves like this).

View solution in original post

10 REPLIES 10

L6 Presenter

Sounds odd...

The like two "newbie mistakes" are already covered by you:

1) It takes something like 15min or so before the ACC starts to index and stuff (or how many minutes it is nowdays).

Which of course means that after 6 hours it cannot be this one...

2) The default is "view last hour" (if I remember correctly) which of course means selecting 6 hours or longer should display you some stuff (in case it were 6 hours ago you last had some traffic).

What about internal clock - did it sync with NTP (or manually) some time after you had start to push traffic through the unit?

Im thinking that the clock was incorrect and once set it had already pushed stuff into the db which means that you can either just throw away all logs and start over or just wait until it will pass the old time before new data starts to show up?

I assume you have verifiied that you actually do have "log on session end" (or even "log on session start" as debug) on each security rule you wish to log?

Hi Mkiand,

Thx for your suggestions !

Yes indeed:

- NTP has been configured, even before the (data) interfaces were connected. So, onboard time sync was and is now also still in sync.

- For data we want to see, there's an LOG AT START enabled. Should both (start/end) be enabled preferably to have correct and relevant data in ACC ?

I already informed our Palo Alto engineer about this issue. He asked to open a support case in order to have a closer look.

Just 1 remark: I don't know whether there's a link between both, but after creating a CUSTOM REPORT which forced to get data from the threat database for the past +/- 24hours, drilling down into the "Threat monitor" reveals fine grained information about sources/destations/etc.

So, I tried to build a similar custom build report that forced to fetch data from "traffic" database, though the result was not successful: "no matching record" after drill down in the "Traffic monitor"

I'll keep this thread up to date once a solution is provided from the support case. 

The main difference between "log on session start" and "log on session end" is:

- Session end will display traffic volume (total bytes).

- Session end will display the resulting AppID.

The volume thingy is pretty obvious but the resulting AppID thing means that for example if you visit facebook the actual identifications might be (not correct but as an example):

- unknown-tcp

- web-browsing

- ssl

- facebook (that is if you have ssl-termination in place)

The first three logs will be from "log on session start" while the forth will be from "log on session end".

A drawback with "on session end" is of course that the log post doesnt show up until the session really ends but on the other hand if you wish to keep number of logrows to a minimum "log on session end" will bring you more info than "log on session start".

So what one usually does is to enable "log on session end" for all security rules and "log on session start" on those you need to debug (and then turn off "log on session start" once the troubleshooting session is over).

A quickfix in your case would probably be to just clear all logs and start over but since you opened a case I think its best to wait until the support returns to you in case there is a bug somewhere which must be fixed in the PANOS (but also to get an answer of why your logging behaves like this).

The assigned system support engineer provide exactly the same information as described by you.

Concerning the 'awkward' phenomenon about starting fined grained information after having build that custom report, that must have been a coincidence/mix up.

Now, all information is available while drilling down into menus of the Application Command Center.

Thanks again for your valuable feedback.

Does this also mean that if you completely turn logging off on a rule, no information for that rule will ever show up in ACC? So ACC relies completely on logging information? Silly question, I know, but I want to make sure I understand.

Thats how I understands this...

If you disable logging for a particular security rule then this traffic wont show up in traffic/threat logs and by that not show up in ACC either.

If you turn off logging for a rule, the Palo Alto Networks firewall will still show some basic information in the ACC, but you won't get any detailed information.  I just tried this on my lab firewall with a very basic setup.  2 security policy rules (permit all from lan1 to lan2, and permit all from lan2 to lan1) - no logging on either rule. 

I fired up ping and let it run for ~30 minutes.  I also fired up FTP and sent some files through as well.  I waited for the logindexer process to churn through the data (I think it happens every 10 minutes or so).  And when I come check out the ACC, here's what I see:

So the answer is "No", you don't need any logging turned on in order to get _some_ ACC data.  That being said, you won't have any "drill-down" capability.  For example, if I click on "Ping", here's what I see:

So, all of the fields that show "No matching record" require logging to be enabled for those security policy rules - and those are written to the Traffic Log.  I believe the top-level ACC data is held in a different database (Application Statistics).  There are additional databases on the firewall as well (URL / Threat / Config logs, etc.)  If you go to the Custom Reporting section of the firewall, create a new report, and then use the "Database" dropdown list, you'll see the options (Application Statistics or Traffic, for example).

Hope that helps.

Thanks , that helps! Smiley Happy

L4 Transporter

Awesome thread... a guy at work and I were just kicking around whether or not logging affects the ACC. This thread answers that question!

Will these results still be true if you in the bottom of your lab-PA puts a any, any, deny, no log?

Im thinking if the builtin default log somehow would add this stuff to the ACC (similar to how QoS is connected to internal statistics graphs).

  • 1 accepted solution
  • 6776 Views
  • 10 replies
  • 0 Likes
Like what you see?

Show your appreciation!

Click Like if a post is helpful to you or if you just want to show your support.

Click Accept as Solution to acknowledge that the answer to your question has been provided.

The button appears next to the replies on topics you’ve started. The member who gave the solution and all future visitors to this topic will appreciate it!

These simple actions take just seconds of your time, but go a long way in showing appreciation for community members and the LIVEcommunity as a whole!

The LIVEcommunity thanks you for your participation!