About process pan_task of dp-monitor.log

cancel
Showing results for 
Show  only  | Search instead for 
Did you mean: 
Announcements
Please sign in to see details of an important advisory in our Customer Advisories area.

About process pan_task of dp-monitor.log

L4 Transporter

Hello,

I have a question about the process "pan_task" of dp-monitor.log, it always shown high cpu usage.

Any one can tell me what the mean is ?

Thanks.

pan_task.png

1 accepted solution

Accepted Solutions

The CPU output from the TOP command can not be used to determine dataplane load.  The pan_task processes are always at 100% CPU utilization as they are the individual software processes which perform packet processing on the dataplane. 

As others have stated, you should use output from "show running resource-monitor" on the CLI to determine the true dataplane load.  This command is also run and logged to the dp-monitor.log files on the dataplane so you can look at historical utilization as well.  In the output from this command on a 2050 you will see 4 individual cores listed, 0-3.  The pan_task processes shown in the top output correspond to cores 1-3 listed in this output.  On other platforms you will find a pan_task process is running for each core beyond core 0.

View solution in original post

6 REPLIES 6

L5 Sessionator

Hello,

The Pan_task are the threads in the dataplane, where the packets are processed , and they would always show values like 99% or 100%. It is a legitimate value and means that the dataplane is busy processing all the packets that it receives.

Best regards,

Karthik RP

L5 Sessionator

To know the actual dataplane load, you can use the command:

> show running resource-monitor

Best regards,

Karthik RP

L4 Transporter

Hello,

My device is PA2050 which runs PanOS 4.1.12.

Thanks.

L5 Sessionator

I can see a similar output even in on of lab devices:

Jun 24 18:30:35:  --- top

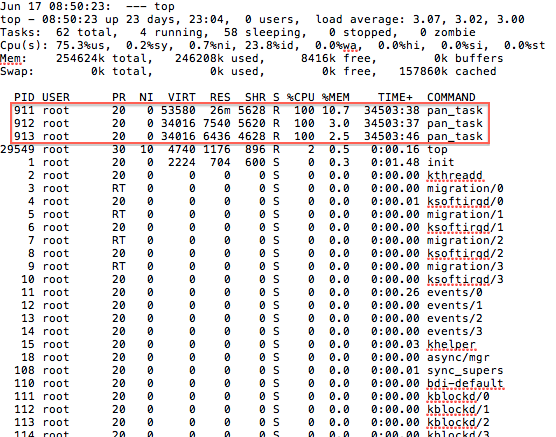
top - 18:30:35 up 24 days,  7:21,  0 users,  load average: 3.00, 3.00, 3.00

Tasks:  62 total,   4 running,  58 sleeping,   0 stopped,   0 zombie

Cpu(s): 75.2%us,  0.1%sy,  0.4%ni, 24.0%id,  0.3%wa,  0.0%hi,  0.0%si,  0.0%st

Mem:    254608k total,   238780k used,    15828k free,        0k buffers

Swap:        0k total,        0k used,        0k free,   136968k cached

  PID USER      PR  NI  VIRT  RES  SHR S %CPU %MEM    TIME+  COMMAND

  862 root      20   0 49032  25m 5108 R  100 10.3  35001:16 pan_task

  863 root      20   0 29468 6588 5080 R  100  2.6  35001:14 pan_task

  864 root      20   0 29468 5744 4260 R  100  2.3  35001:17 pan_task

29656 root      30  10  4740 1176  896 R    2  0.5   0:00.10 top

what is your output on running-resource monitor

The CPU output from the TOP command can not be used to determine dataplane load.  The pan_task processes are always at 100% CPU utilization as they are the individual software processes which perform packet processing on the dataplane. 

As others have stated, you should use output from "show running resource-monitor" on the CLI to determine the true dataplane load.  This command is also run and logged to the dp-monitor.log files on the dataplane so you can look at historical utilization as well.  In the output from this command on a 2050 you will see 4 individual cores listed, 0-3.  The pan_task processes shown in the top output correspond to cores 1-3 listed in this output.  On other platforms you will find a pan_task process is running for each core beyond core 0.

  • 1 accepted solution
  • 18037 Views
  • 6 replies
  • 0 Likes
Like what you see?

Show your appreciation!

Click Like if a post is helpful to you or if you just want to show your support.

Click Accept as Solution to acknowledge that the answer to your question has been provided.

The button appears next to the replies on topics you’ve started. The member who gave the solution and all future visitors to this topic will appreciate it!

These simple actions take just seconds of your time, but go a long way in showing appreciation for community members and the LIVEcommunity as a whole!

The LIVEcommunity thanks you for your participation!