- Access exclusive content
- Connect with peers
- Share your expertise
- Find support resources
Click Preferences to customize your cookie settings.
Unlock your full community experience!
SysLog setup not working
- LIVEcommunity
- Discussions
- General Topics
- Re: SysLog setup not working
- Subscribe to RSS Feed
- Mark Topic as New
- Mark Topic as Read
- Float this Topic for Current User
- Printer Friendly Page
SysLog setup not working
- Mark as New
- Subscribe to RSS Feed
- Permalink
09-18-2012 04:35 AM
Hi,
I am using PA-2050, with PAN OS 4.1.3.
From few days I am trying to configure the syslog to be sent to a central logging system. I followed every possible documentation, but I am not getting any syslogs coming to the syslog server. I tried on syslog server on linux and windows. I tried splunk, kiwi and few more. and finally I could conclude that PA is not sending out the logs to any servers.
I followed the configuration as seen on the following URL
http://www.sawmill.co.uk/docs/Sawmill-Integration-with-PaloAlto-Networks.pdf
Then I used the tcpdump to verify that PA is sending something to my syslog server but the output was 0. I used the tcpdump as following
tcpdump -v udp and port 5055 -w test.log
by the way I am not using the standard port, instead I am using udp 5055 to listen on my syslog server. The port is open on my syslog server as I can see that in netstat command.
Then I configured PA with system logging (Device-> Log Settings -> Config and Device -> log Settings -> System) and what I could see is that system based logs coming to the syslog server, but not anything related to the user traffic.
I doubt if I am missing something. Can you people please help me with this.
- Labels:
-
Configuration
-
Management
-
Troubleshooting
- Mark as New
- Subscribe to RSS Feed
- Permalink
09-18-2012 08:36 AM
Absolutely yes. But nothing happens. I just thought of rebooting the device once and remove everything just to start from scratch, "only the logging part"
- Mark as New
- Subscribe to RSS Feed
- Permalink
09-18-2012 03:15 PM
Hi,
Please verify if you have configured in the following manner.
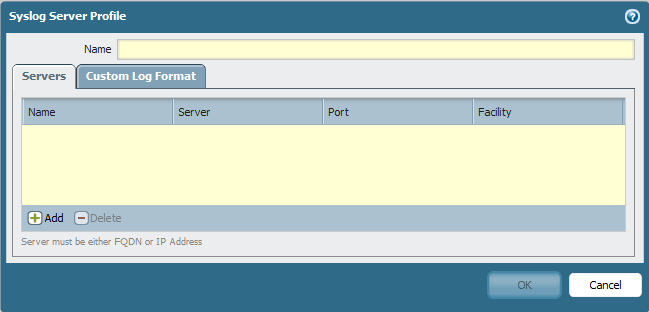
Under Device tab--> server profiles---> syslog
you create a syslog server profile
and do the commit.
Please verify that the ip address of the server and port has been configured correctly and are correct. If ping is allowed then to CLI and use following command to ping the syslog server and see if you get response.
ping host <ipadress>
This above command will ping from the management server.
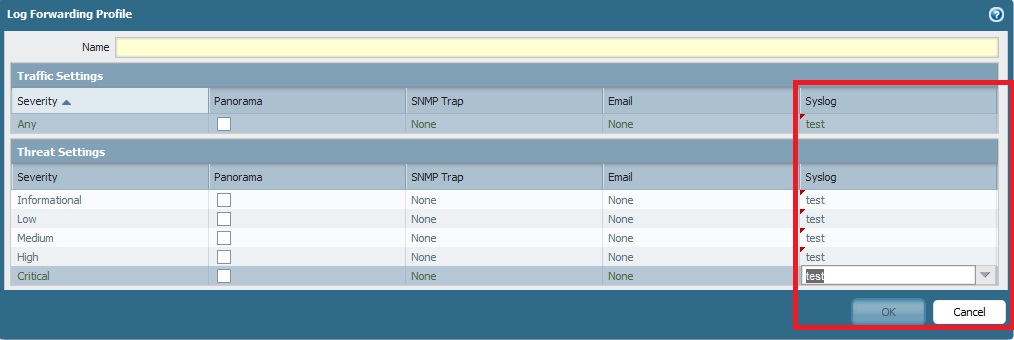
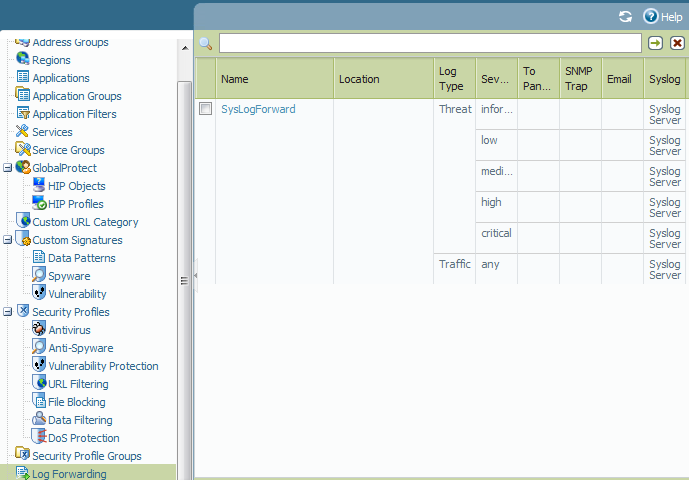
Then you go to log forwarding option under
Objects tab--> log forwarding
Then choose that profile in the log forwarding profile for the logs you want forwarded to the syslog
make sure to do the commit.
This will allow you to forward the traffic logs for all the severity and if you want you can forward it for all the threat logs or the needs threat logs.
How is your management interface configured. Is it passing through the firewall. If yes it is possible that it is getting dropped by one of the security policy.
Please check the traffic log to verify if your traffic is getting dropped.
If it is a internal to internal zone by default that traffic will not show in the logs please make sure a rule is created to show that traffic so you can verify.
If the above suggestion doesn't work either then try to route the syslog traffic through one of the data ports.
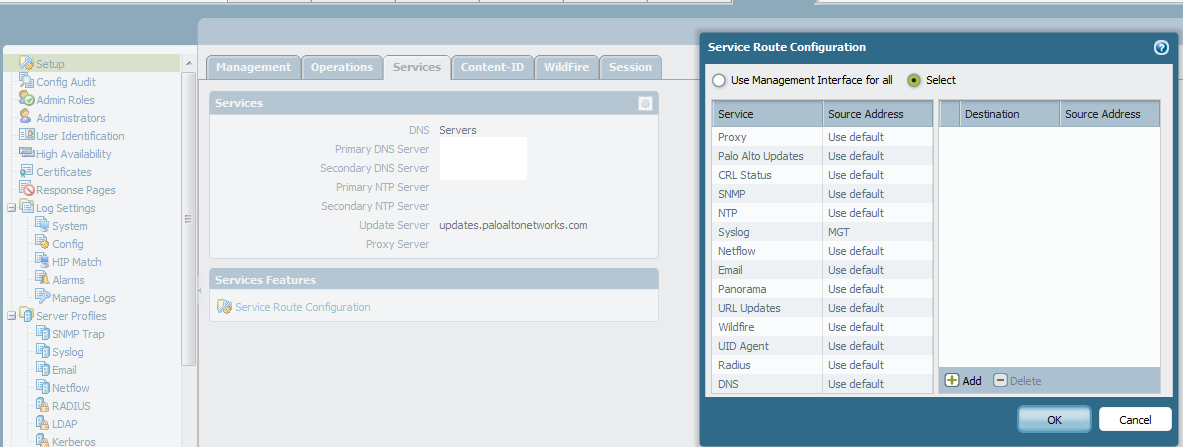
Go to device tab--->setup---> services tab---> service route configuration and select any external interface and see if the traffic is being sent now.
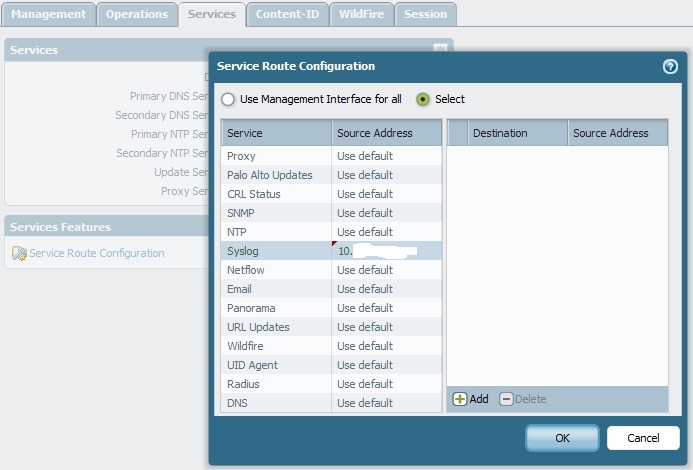
If the above configuration works then there might be an issue for the management server to reach to the syslog server.
Let us know if this helps.
Thank you
mbutt
- Mark as New
- Subscribe to RSS Feed
- Permalink
09-18-2012 04:01 PM
As you have mentioned you are not seeing any syslog messages being sent out of the pan in the tcpdump, the issues could be on pan side. I would recommend you to restart the mgmt server and see if it help this will NOT effect any of your live traffic. You can try this with the command "debug software restart management-server" also can you please let me know if the actual traffic logs are showing up as expected ? I mean the device is logging the traffic and you are able to see that in the traffic and threat logs ?
Thanks,
Sandeep T
- Mark as New
- Subscribe to RSS Feed
- Permalink
09-18-2012 10:54 PM
Hi Mbutt,
Thank you for the screenshots. I did exactly as you said, but the only thing I didn't do is that I didn't commit after every single step, but I did after everything. Not sure how the PA does normally but in my case PA will take almost 2-4 minutes for each commit.
My setup is as following
My syslog server listening for port 5140 (I am using 514 for something else)

My PA setup Log forwarding Profile My security Rules
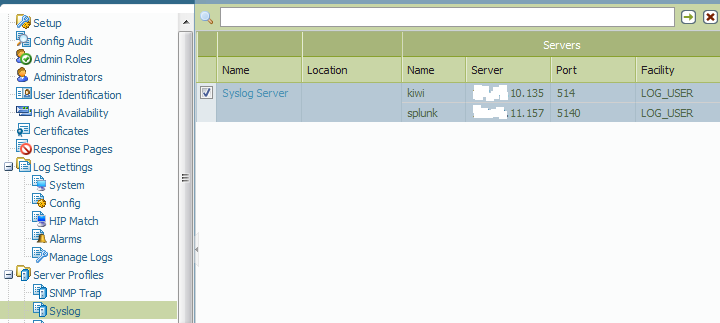

Service Route (I changed after your reply)
After all these I am not getting any hit on syslog server on port 5140, it stays 0 I verified this after dumping on port 5140 for more than 12 hours and still the count is zero. basically I would expect few hundreds hits per second. I have huge activity on my network
a tcpdump showing if any hits on the specific port 5140, unfortunately there is 0 hits

Here ends my configuration and monitoring.
Now I configured the syslog for the system from the following
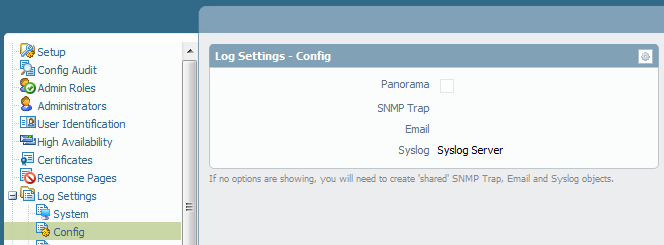

I believe this is for the PA system logs and not related with any user traffic.
But when I configure this log to my central logging server I will get hit like 1 or 2 in few minutes

This is just to confirm that there is no routing issue between PA and my server and there is no configuration mistakes on both syslog server and PA config.
No idea how to proceed now. It was working before. The only change is that I had my server changed to new IP.
As sdurga said I had a management server restart, that also didn't help. But when I executed the "debug software restart management-server" command I got an output like the following
Process 'mgmtsrvr' executing RESTART
Sep 19 07:33:36 Error: pan_read_full(comm_utils.c:97): srvr: fatal recv error. sock=3 err=Connection reset by peer (131)
- Mark as New
- Subscribe to RSS Feed
- Permalink
09-18-2012 11:31 PM
That is expected output. Please open up a ticket with support there might be something else going on the device.
Thanks
Sandeep T
- Mark as New
- Subscribe to RSS Feed
- Permalink
04-22-2024 02:34 PM
Hello, i know this is the old post, I am having a similar issue. Were you able to fix the issue? If so do you remember the fix?
- Mark as New
- Subscribe to RSS Feed
- Permalink
05-15-2024 07:15 AM
I face the same issue after changing the Syslog IP to the new server.
May i know what version you are running on? Just to verify if we are running on same version may be it could be bug.
- 24093 Views
- 8 replies
- 0 Likes
Show your appreciation!
Click Accept as Solution to acknowledge that the answer to your question has been provided.
The button appears next to the replies on topics you’ve started. The member who gave the solution and all future visitors to this topic will appreciate it!
These simple actions take just seconds of your time, but go a long way in showing appreciation for community members and the LIVEcommunity as a whole!
The LIVEcommunity thanks you for your participation!


