- Access exclusive content
- Connect with peers
- Share your expertise
- Find support resources
Click Preferences to customize your cookie settings.
Unlock your full community experience!
Prisma Cloud CWP Radar
- LIVEcommunity
- Products
- Cloud Native Application Protection
- Prisma Cloud
- Prisma Cloud Articles
- Prisma Cloud CWP Radar
- Subscribe to RSS Feed
- Mark as New
- Mark as Read
- Printer Friendly Page
- Mark as New
- Subscribe to RSS Feed
- Permalink
on 01-25-2024 09:22 AM - edited on 10-29-2024 12:23 PM by RPrasadi
Pramod Dhamenia, Senior Cloud Security Engineer
Introduction
Cloud Technology has rapidly evolved in the last decade resulting in several benefits like agility, scalability, flexibility and cost optimization over traditional on-prem data centers and accelerated innovation and rapid product delivery in organizations.
However, agility comes with challenges such as blind-sided visibility and limited security. Prisma Cloud Runtime Security provides tools to give your organization visibility and security into your cloud environment. In this article, we will explore the visibility tools that Prisma Cloud provides to get visibility into your cloud environments.
Radar
Radar (Radio detection and ranging) is a military term used for detecting, locating, tracking, and recognizing objects of various kinds at considerable distances. The targets may be aircraft, ships, spacecraft, automotive vehicles, astronomical bodies, or birds, insects, and rain.
Prisma Cloud Runtime Security formerly known as CWP (Cloud Workload Protection) Radar provides the ability to detect and protect your cloud-native assets via Cloud discovery. Prisma Cloud breaks the silos across different Business Units and provides a centralized dashboard for your next-generation cloud-native assets via RADAR.
Radar is a single pane of glass for various security personas. It gives a 10,000ft - birds-eye overview to visualize what assets have been deployed in your cloud environment, and a detailed view providing environment-specific information such as OS distribution, Kubernetes version, Vulnerabilities present, and Compliance issues.
The Default View of Radar
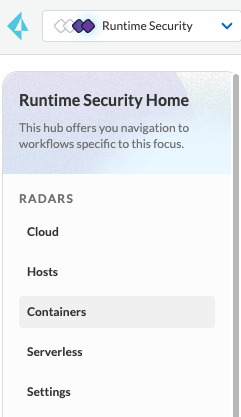
When you select Runtime Security in Prisma Cloud, you start in RADARS:
Figure 1: Radar Menu_palo-alto-networks
2.0 Radar Pivots
Radar contains a number of views:
- Cloud
- Hosts
- Containers
- Serverless
2.1 Cloud Pivot
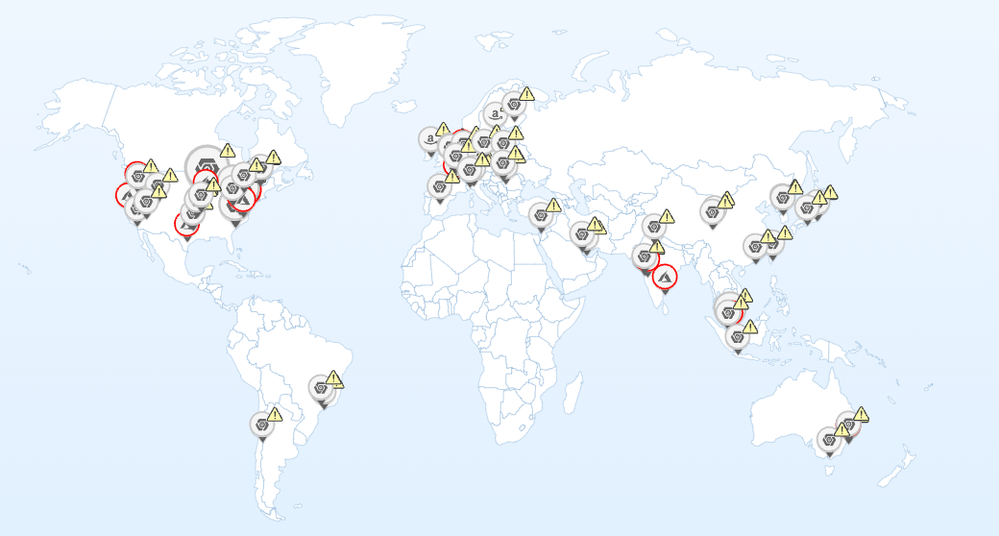
Cloud pivot presents a view of Cloud Service Providers (CSPs) used in different regions on a Global scale.
Figure 2: Cloud Pivot on Radar_palo-alto-networks
Filters such as Regions, Provider, Services, and Account Names can be used to view specific information.
Figure 3: Filters on Cloud Pivot_palo-alto-networks
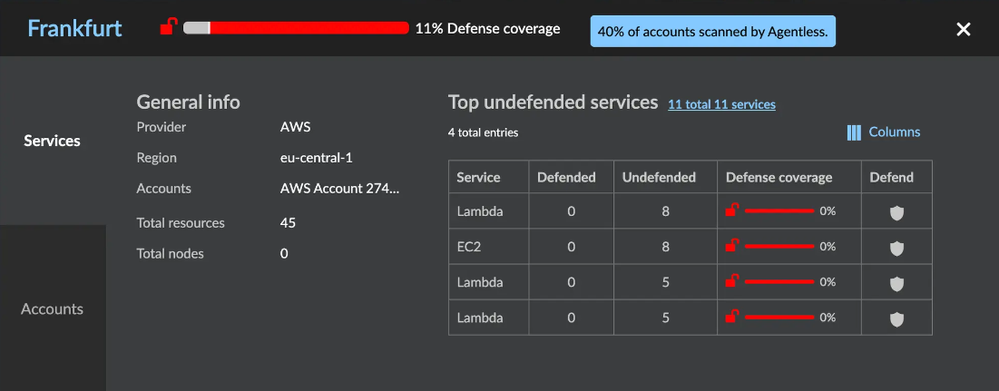
Information from a regional cloud data-center can be viewed by clicking on the dot. This gives details about the regional data-center including which services are protected and unprotected.
Figure 4: Deployed assets view on Cloud Pivot_palo-alto-networks
Viewers also have the option to defend their unprotected cloud accounts via Agentless scanning when the view is changed to “Services” from “Accounts”.
2.2 Host Pivot
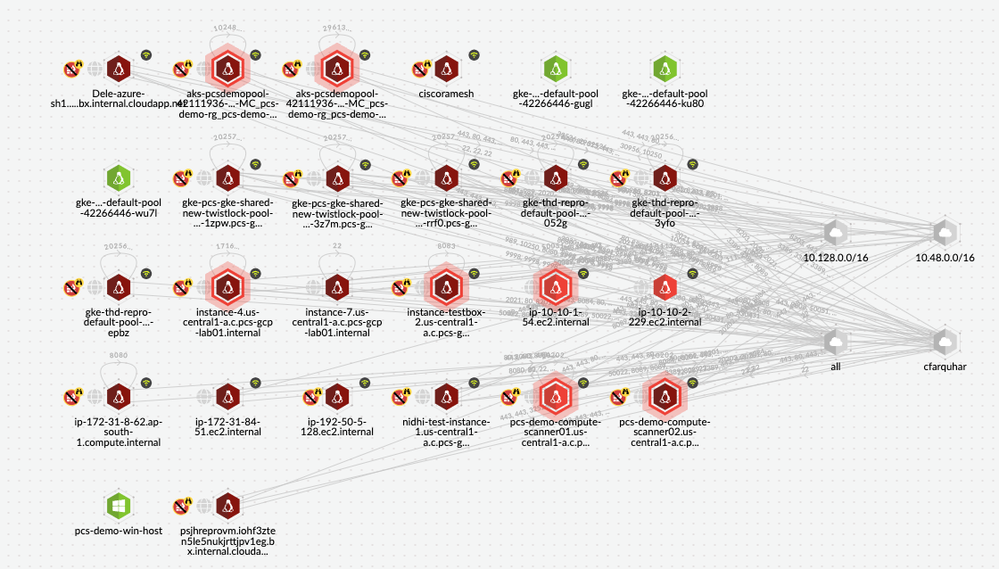
Host pivot presents a view of all the virtual machines discovered in your Cloud Accounts with network communication paths in a graphical view.
Figure 5: Host Pivot on Radar_palo-alto-networks
When enquiring about a host, you see a high-level risk summary that comprises attributes like environment, Network, and web traffic communication (WAAS). Information such as the most critical Vulnerability / Compliance risks, runtime audits, and incidents are all available from this view.
Forensic data is available for hosts involved in an incident, and you can see warnings such as “host involved in an incident” and “unprotected web application running on the host” displayed at the top of the popup in red.
Figure 6: Detailed Host information on Radar_palo-alto-networks
2.3 Container Pivot
Container pivot presents a view of all clustered and non-clustered container environments. You can explore the container level detail, similar to exploring the host level detail in the Host Pivot.
Figure 7: Container Pivot on Radar_palo-alto-networks
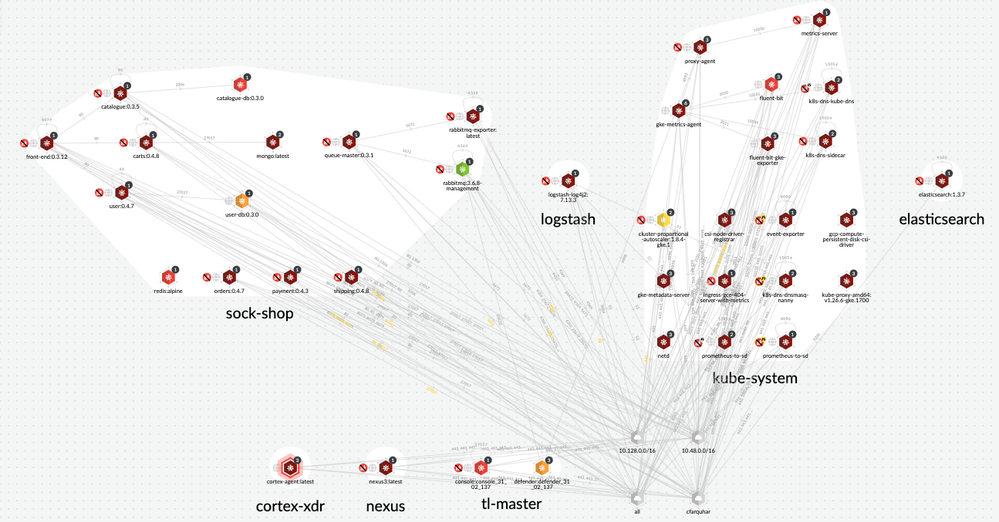
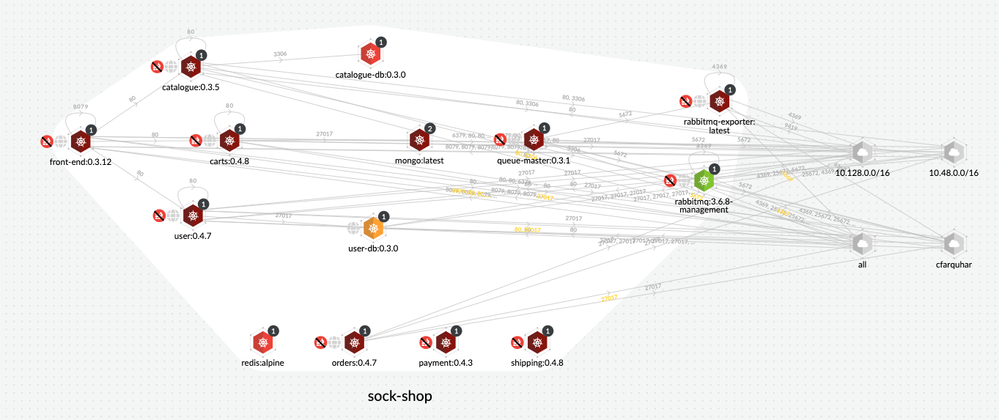
Prisma Cloud shows the network communication paths between containers, namespaces, and outbound gateways in a graphical view.
Figure 8: Kubernetes Clustered view on Radar_palo-alto-networks
Figure 9: Namespace-specific view on Radar_palo-alto-networks
When a container is explored further, Image information, Cluster, Namespace, OS Distro, and Service Accounts are available in addition to the high-level risk summary also on host pivot.
Figure 10: Detailed Container specific information on Radar_palo-alto-networks
Microservice architecture information is available as additional information:
- container-container communication within namespace
- containers communicating outside namespace with tcp ports
- frontend gateway communications
Figure 11: Container to container communication information on Radar_palo-alto-networks
Figure 12: Frontend container to Internet communication information on Radar_palo-alto-networks
2.4 Serverless Pivot
Serverless pivot provides a view of AWS Lambda functions, showing how a function is invoked via its triggers and what services the Lambda functions utilize.
Figure 13: Serverless graph view on Radar_palo-alto-networks
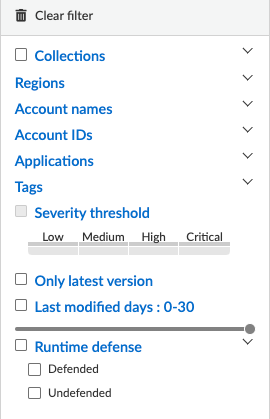
You can use filtering to find:
- an application-specific function,
- what functions are defended or undefended, or
- how many lambda functions exist in a given AWS account.
Other filtering options include:
Figure 14: Filters for Serverless Pivot on Radar_palo-alto-networks
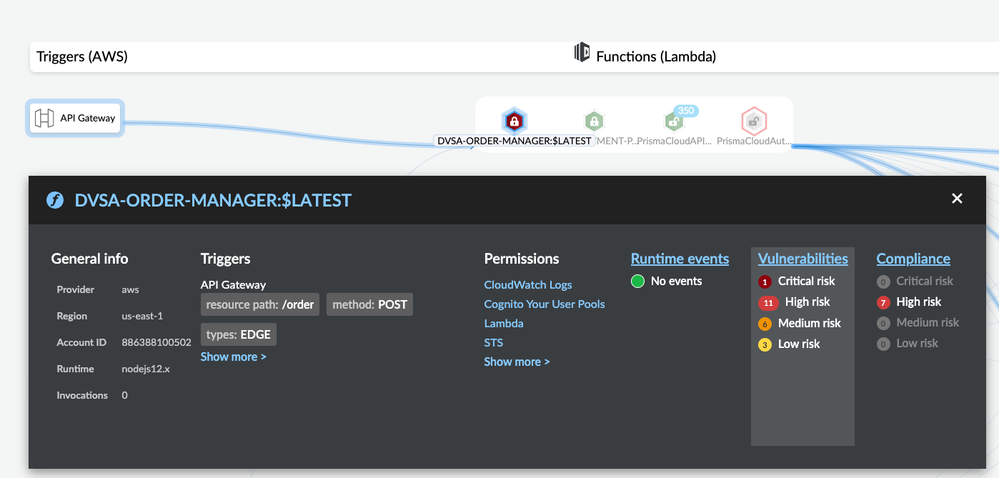
Detailed information about a lambda function can be found by clicking on the node. In addition to the details you have seen in other pivots, the serverless pivot also displays Permissions for the services that have been granted to the selected Lambda function.
Figure 15: Detailed Serverless Function information on Radar_palo-alto-networks
Prisma Cloud will also display the IAM permissions that every service has granted to the lambda functions by clicking on the specific service under Services. In the figure below, Prisma Cloud displays which functions can access S3 Service.
Figure 16: Functions accessing AWS S3 Service on Radar_palo-alto-networks
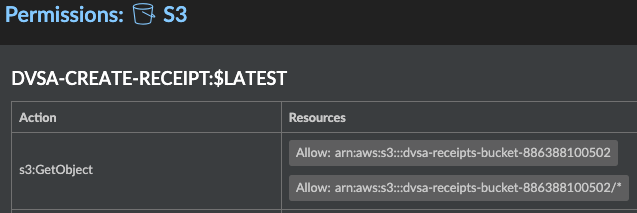
By clicking on Actions under the details tab Prisma Cloud displays the exact permissions given the Lambda function. As shown in the figure below, the specific actions this Lambda function has on the specified resources.
Figure 17: A lambda function with specific permissions assigned for AWS S3 Service on Radar_palo-alto-networks
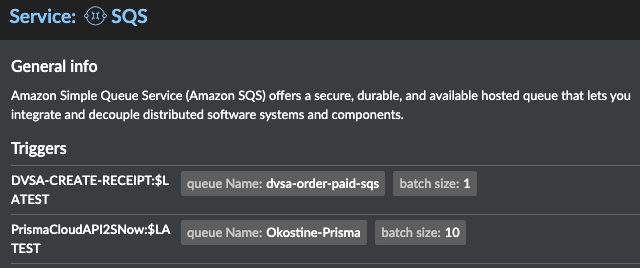
Prisma Cloud can also find which triggers have been created for a specific event type.
3.0 Radar Settings
Radar Settings allow us to specify what network connections can be monitored, whether to monitor connections between containers
- on a single host
- across all hosts
Figure 19: Radar Settings_palo-alto-networks
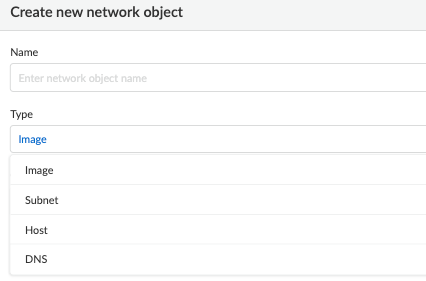
Prisma Cloud allows us to create groupings of objects on radar pivots called Network Objects.
- Image, Network, Host and DNS type are supported network objects.
- For Image and Host type, the scope is selected from defined collections
- For Subnet, a single IP address or a range of IP addresses can be defined.
- For DNS, a domain such as “google.com” or “8.8.8.8” can be defined.
Figure 20: Network Object Types_palo-alto-networks
Reference the documentation for further details on Network Objects.
3.1 Decoding the color code in Radar
Nodes are color coded in 5 different colors to identify the security risks easily.
- Dark Red – High risk. One or more critical severity issues detected
- Red – High severity issues detected
- Orange – Medium severity issues detected
- Yellow – Low severity issues detected
- Green – Denotes no issues detected
- Gray — Only applies to Serverless function and denotes that Prisma Cloud hasn’t been configured to scan this function for vulnerability and compliance issues
Figure 21: Nodes with different color codes_palo-alto-networks
This color coding applies to all workload types - Host, Containers and Serverless. You can also switch the risk type between Vulnerabilities, Compliance and Runtime for all workload types.
3.2 Understanding special symbols and networking in Radar
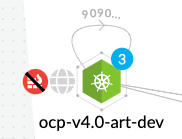
When an unprotected web application is detected, it is reflected with a red striked-over firewall symbol
Figure 22: Unprotected Web Application Symbol_palo-alto-networks
The number in the circle reflects the number of containers running in a specific pod. The color of the circle specifies the state of the container’s runtime model. A blue circle indicates the container’s model is still in learning mode while a black circle indicates the container’s model is activated.
A globe symbol indicates that a container can access the Internet.
Connections between running containers are depicted as arrows in Radar. Dotted line reflects an existing network path between pods. When the traffic is observed, the dotted line becomes a solid line.
Figure 23: Network connections between 2 container pods_palo-alto-networks
Figure 24: Network connections between 2 container pods_palo-alto-networks
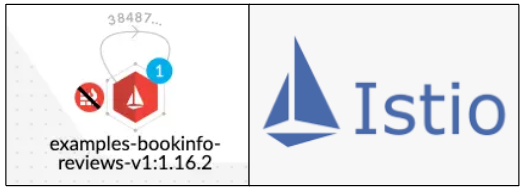
Prisma Cloud can also discover Istio service mesh if defenders are deployed with the “Monitor Istio” feature set enabled. Once successfully deployed, the pods display the Istio logo.
Figure 25: Istio enabled monitoring_palo-alto-networks
4.0 Conclusion
Prisma Cloud Runtime Radar is an important cloud security asset monitoring interface. Radar gives visibility into your microservices environment for known and unknown traffic and prevents lateral movement.
Radar helps to collate all the data on Prisma Cloud and provides bird's-eye visibility at first glance. Radar also provides a detailed view of different kinds of assets to identify security risks such as Vulnerabilities, Compliance, runtime monitoring, web application, and API traffic.
The importance of Radar lies in its ability to visualize cloud-based application/microservices architectures for inter-network and intra-network connections between containers, apps, and cluster services across your environment.
Reference
[1] Prisma Cloud Administrator’s Guide (Compute), Prisma Cloud RADAR
About the Author
Pramod Dhamenia is a senior cloud security engineer specializing in Prisma Cloud, Next-Generation Firewall, AWS, Azure, GCP, containers and Kubernetes. Pramod utilizes a collaborative and consultative approach to break down complex cyber security problems into solutions for global enterprise customers and leverage their multi-industry knowledge to inspire success.
- 3871 Views
- 0 comments
- 3 Likes
- How to Create a Custom Rule for Container Runtime Policy in Prisma Cloud Articles
- Power of Tags in Prisma Cloud. How to implement them? How to use them? in Prisma Cloud Articles
- Microsoft Azure NSG flow log setup and benefits in Prisma Cloud in Prisma Cloud Articles
- How to Deploy Prisma Cloud App-Embedded Defender in Azure ACI in Prisma Cloud Articles
- Host Auto-defend for AWS EC2 Instances in Prisma Cloud Articles
-
Access Control
1 -
Access Key
1 -
ACI
1 -
Action Plans
1 -
Active Directory Groups
1 -
Agentless
2 -
Agentless VM Scanning
1 -
AI
1 -
AI-Driven solution
1 -
AISPM
1 -
Amazon ECS
1 -
Amazon Eventbridge
1 -
API
2 -
App Embeded
1 -
AppDNA
1 -
Application Programming Interface
1 -
ApplicationSecurity
1 -
Approach
1 -
ASPM
1 -
Asset inventory
1 -
Asset Inventory Dashboard
1 -
Asset Inventory. AWS EKS
1 -
Assets
1 -
Attack Path
1 -
Attack path vectors
1 -
Audit
1 -
audit stream
1 -
Authentication
1 -
Authorization
1 -
Auto Map
1 -
auto-remediation
2 -
automatic defender install
1 -
AWS
1 -
AWS Account Onboarding
1 -
AWS Cloud Watch
1 -
AWS EC2
1 -
AWS Secrets Manager
1 -
Azure
6 -
Azure Cloud Accounts
1 -
Azure Container Instances
1 -
Azure RBAC
1 -
Azure Sentinel
1 -
Azure Single Sign On (SSO)
1 -
Azure VM Image Scanning
1 -
Beginner to Intermediate Level
5 -
Building Images
1 -
CI
1 -
CICD
1 -
CLI command
2 -
cloud assets
1 -
Cloud Performance monitoring
1 -
Cloud Security
10 -
Cloud Security Posture Management
1 -
Cloud Security Posture Management (CSPM)
6 -
Cloud Workload Protection
1 -
Cloud Workload Protection Platform (CWPP)
4 -
Collection Scoping
1 -
compliance scanning
1 -
Compliance Standard
1 -
Compute
2 -
Compute Edition
4 -
Compute SaaS
1 -
Configuration
1 -
console
1 -
Container Defender
2 -
Container Image
1 -
Container Runtime
1 -
Containers
2 -
Control Plane
1 -
Cost Optimisation
1 -
cspm
2 -
Custom rules
1 -
Custom Runtime Rules
1 -
CVE
2 -
CWP Token
1 -
CWPP
3 -
DaemonSet
1 -
Daemonsets
1 -
Dashboards
1 -
Defender
2 -
Defender Deployment
5 -
Defender Upgrade
1 -
devops
1 -
DevSecOps
1 -
DevSecOps ShiftLeft
2 -
DevTools
1 -
docker swarm
1 -
EKS logs
1 -
Event Assisted Ingestion
1 -
Eventbridge
1 -
events
1 -
FinOps
1 -
FN
1 -
FP
1 -
GCP Organization Onboarding
1 -
General Articles
2 -
GitHub
2 -
GitOps
1 -
GKE
1 -
Google Security Operations
1 -
Helm Charts
1 -
host auto defend
1 -
Host Defender
1 -
host vulnerabilities
2 -
Hosts
1 -
Hub account
1 -
IAC
1 -
IAM
1 -
IAM misconfigurations
1 -
Identity federation.
1 -
Image Scanning
1 -
Ingress
1 -
install defender
1 -
Integration
2 -
Intermediate Skill Level
2 -
Jenkins
1 -
Jfrog Artifactory
1 -
Jira
1 -
Jira Tickets
1 -
JIT
1 -
JWT
1 -
JWT Token
1 -
Kubernetes
7 -
Kubernetes auditing
1 -
Kubernetes Clusters
1 -
lateral movement
1 -
Layer
1 -
Least Privilege
1 -
Least privilege Principle
1 -
Log4j
1 -
MFA (Multi-Factor Authentication)
1 -
Microsoft Azure subscriptions
1 -
Microsoft Entra.
1 -
Nested Account Groups
1 -
Network
1 -
Network Anomaly
1 -
Network Exposure
1 -
NGINX
1 -
NSG Flow Logs
1 -
NVD
1 -
Onboarding
2 -
Onebox
1 -
Organizing Cloud Resources
1 -
PAM (Privileged Access Management)
1 -
PCEE
1 -
playbooks
2 -
Plug in
1 -
Postman
1 -
prioritize risk
4 -
Prisma "cloud code security" (CCS) module
1 -
Prisma Cloud
31 -
Prisma Cloud Asset Inventory Dashboard
1 -
Prisma Cloud Code Security
1 -
Prisma Cloud Compute
6 -
Prisma Cloud Compute Edition
7 -
Prisma Cloud Compute Edition Administrator’s Guide
1 -
Prisma Cloud Enterprise Edition
2 -
Prisma Cloud Intelligence Stream(IS)
3 -
Prisma Cloud Intelligence Stream(IS) feed
2 -
Prisma Cloud SaaS API
1 -
Prisma Cloud Terraform Provider
1 -
PrismaCloud
1 -
privilege escalation
1 -
protect your EC2
1 -
Radar
1 -
RBAC (Role-Based Access Control)
1 -
Recursive Hierarchy
1 -
reference “Prisma Cloud Administrator’s Guide”
1 -
reference “Prisma Cloud Compute Edition Administrator’s Guide”
2 -
Risk Prioritization
1 -
RQL
1 -
Runtime
1 -
Runtime security
3 -
SDLC
1 -
Secrets
2 -
SecureDevelopment
1 -
Security
2 -
Security Posture
1 -
security-relevant events
1 -
Serverless
1 -
Service Account
1 -
shift left
1 -
Shift-Left
1 -
SIEM
1 -
SSO (Single Sign-On)
1 -
tags
1 -
TCP Handshake
1 -
TCPIP
1 -
Terraform
1 -
thread feed
4 -
Threat Intelligence
4 -
TLS Handshake
1 -
Token
1 -
Visibility
1 -
VM
1 -
VM Scanning
1 -
VSCode
1 -
vulnerabilities
1 -
Vulnerability
1 -
vulnerability detection
7 -
Vulnerability Management
7 -
Vulnerability Protection
1 -
WAAS
1 -
Webshell
1 -
Windows
2 -
XSOAR
2 -
Yor
2


